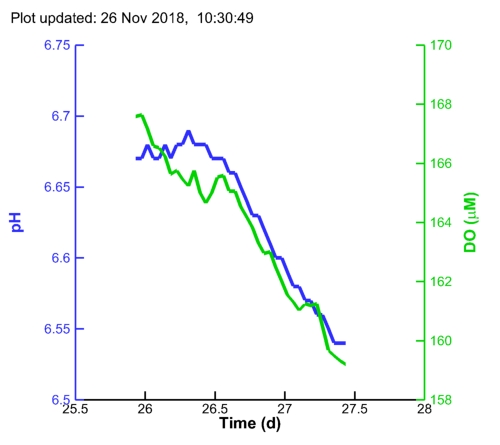
Experiment 1

This experiment explores how resource availability impacts microbial community dynamics.  Resource availability will be manipulated by changing the dilution rate of duplicate chemostats inoculated with a microbial community collected in the surface of Siders Pond, Falmouth MA.  Dilution rates of 0.1, 1.0 and 10 d-1 will be run, and communities will be assessed via V4V5 amplicon sequencing.

Experimental time started at 30 Oct 2018, 00:00; however, chemostats where inoculated with Siders Pond water at 18:30 and medium feed was started at 20:00.

On-line variables associated with MC1 (last 36 points):


Gas concentrations in outputDissolve oxygen and pH in Algal bioreactor
Plot of O2, CO2 over all time.  Plot of pH and DO over all time.  Interactive graphics are also available under the JavaScript Graphics menu item above.  Note, the analog output for the DO probe on MC1 is intermittent; however, the Modbus digital output is working fine, so see the text files below or JavaScript Graphics to check DO.

On-line variables associated with MC2 (Last 36 points):

Concentration of off gases in MC2DO and pH associated with MC2
Plot of O2, CO2 all time.  Plot of pH and DO over all time.  Interactive graphics are also available under the JavaScript Graphics menu item above.

Instrument Drift (between analyzer calibrations), Last 36 points

Instrument Drift
Instrument Drift over all time.

Experimental Events:

  1. At approximately 17:00 on 30-Oct-2018, a 10 L water sample was collected from Siders Pond, Falmouth MA (41.5479890°N, -70.6224940°E) at 2.5 m below the surface and passed through a 300 µm Nytex mesh to remove large organisms and particles.
  2. At 18:30, 3 L of the Siders Pond water was added to two duplicate 3L chemostats
  3. At 20:00, feed of medium was begun at a dilution rate of 0.1 d-1 or 300 mL d-1
  4. Note, experimental time plotted here is referenced to 30-Oct-2018 00:00
  5. Air feed rate to MC1 and MC2 reduced from 20 sccm to 10 sccm (0°C, 1 atm) (15:30 2-Nov-2018, t = 3.65 d).
  6. Dilution rate to chemostats increased from 0.1 d-1 to 1.0 d-1 at 12:33 14-Nov-2018, t = 15.524 d).
  7. Dilution rate to chemostats increased from 1.0 d-1 to 10. d-1 at 18:28 19-Nov-2018, t = 20.770 d).
  8. Last sample taken (~14:30 22-Nov-2018, t = 23.6 d).
  9. Carbon medium exhuasted (~20:30 22-Nov-2018, t= 23.85 d).
  10. Nutrient medium exhuasted (~2:30 23-Nov-2018, t = 24.10 d).
  11. The experiment has come to its end, and all sampling has stopped (11:11 26-Nov-2018, t = 27.466 d).

Data Files:

Primary gas and probe data: Exp1.dat
External variable values: Exp1.oc
Experimental info file: Exp1.info
Compiled high resolution data from DO and pH probes: Exp1_DOpH.csv

Higher resolution (10 min) probe data from Hamilton's RS485 ModBus (updated here every 1 hr):
(Note, these data are now plotted on the JS Graphics page)
MC1 pH: Trace_2018-10-30_19h52_pH_243632-2353-1178.txt,
Trace_2018-11-12_12h53_pH_243632-2353-1178.txt

MC1 DO: Trace_2018-10-30_19h52_DO_242453-02-210052.txt,
Trace_2018-11-12_12h53_DO_242453-02-210052.txt
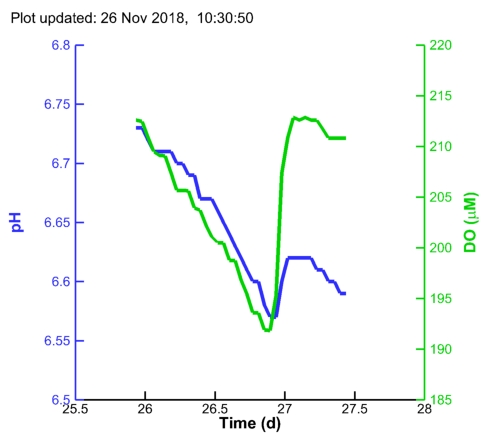
MC2 pH: Trace_2018-10-30_19h53_pH_243632-2353-1176.txt,
Trace_2018-11-12_12h53_pH_243632-2353-1176.txt

MC2 DO: Trace_2018-10-30_19h53_DO_242453-02-210053.txt,
Trace_2018-11-12_12h54_DO_242453-02-210053.txt


Experimental Equipment:

ChemostatsInstruement Rack
Image (left) shows the  Bellco Glass 3 L  microcosms (MCs) on 30-Oct-2018 just prior to start of Exp1. Instrument rack and environmental chamber housing the MCs (image on right) is equipped with MKS mass flow controllers, Oxigraf O2 and CO2 laser diode absorption spectrometer, Nafion drier and a computer for monitoring and experimental control via Valco selector valve, ASCO solenoid valves, Weeder Technologies WTDOT and WTAIN digital IO boards and Comtrol RocketPort serial card.  Monitoring and control software is written in Intel Fortran (gigidy) and all com is via rs232.

Reactor dissolved oxygen (DO) and pH are monitored with Hamilton VisiFerm DO Arc 335 and EasyFerm Plus Arc 325 probes, respectively.  Probes are controlled and calibrated via Hamilton Device Manager software via a USB-ModBus RS 485 Converter.  Data from probes are logged from 4-20 mA signal outputs that are converted to 0-10 V with Wayjun Signal Isolators and digitized with a Weeder Tech WTAIN A2D board (data is also logged via ModBus at higher frequency). 

The microcosms are sparged with air in a Conviron PGR15 environmental chamber that is currently operated at 25 ºC.  A closed gas sampling loop regulated at a flow rate of 250 mL/min by a Hargraves mini pump (B.1F15E4.A12VDC) delivers reactor headspace gas to analyzer.Sample loop has an approximate volume of 20 mL. A Masterflex L/S Digital drive connected to Easy-Load 3 peristaltic pump heads provides exchange flow between reactors.

Software

Program for monitoring instruments and control. Note, software makes use of Intel Visual Fortran's serial IO library:
Graphics are generated by Tecplot and HighCharts

Photos