This is the first 13C tracer experiment using glucose
as the tracer. In approximately 2 weeks the glucose in the
defined medium will be replaced with 100% 13C-glucose in a
step-up pulse, but the feed medium will otherwise be unchanged.
As bacteria consume the heavy isotope, as well as predators (such as
protists, viruses and other bacteria) that consume the enriched
bacteria, their RNA will become enriched with 13C and
detectable using stable isotope probing techniques (also see Fortunato
and Huber 2016). Experimental data will be used to
determine the extent of interconnectivity within microbial communities.
Experimental clock time started at 00:00 5 Feb 2019; however,
chemostats
where inoculated with Siders Pond water at 18:30 with medium feed rate
turned off
to allow the Siders Pond community time to adjust to warm conditions
(25 °C).
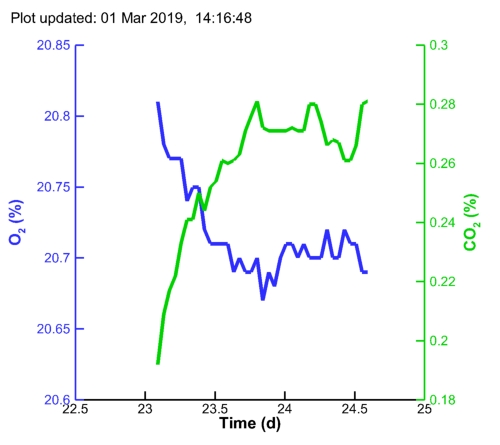
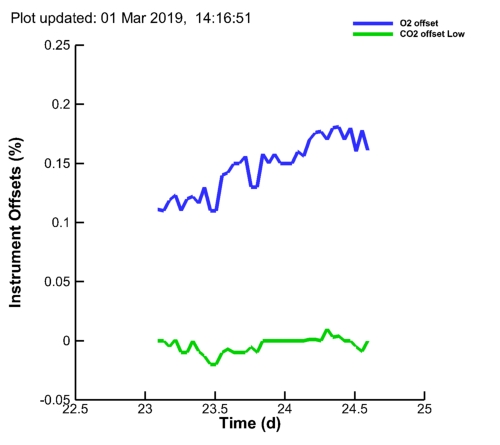
On-line variables associated with MC1 (last
36 points):
Plot
of O2, CO2 over all time. Plot
of pH and DO over all time. Interactive graphics
are also available under the JavaScript
Graphics
menu item above. Note, the analog output for the DO probe on MC1
is intermittent; however, the Modbus digital output is working fine, so
see the text files below or JavaScript Graphics to check DO.
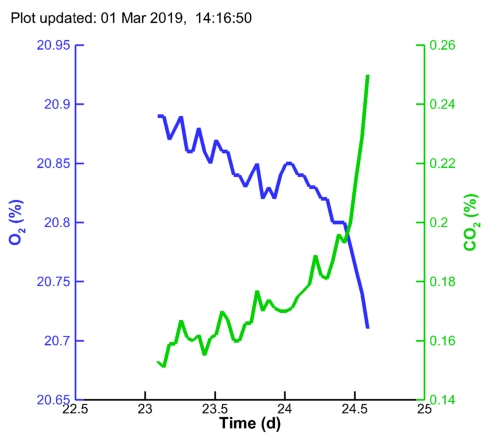
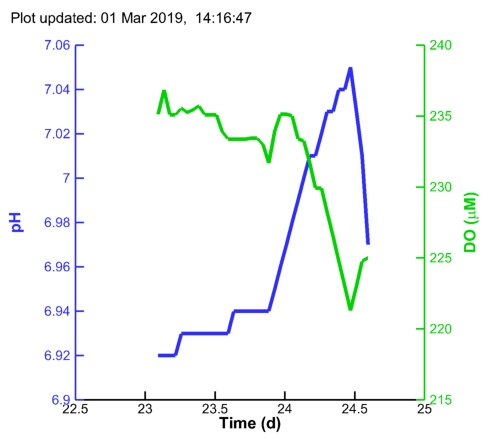
On-line variables associated with MC2
(Last 36 points):
At approximately 14:30 on 5-Feb-2019, a 20 L water sample was
collected from the surface of Siders Pond, Falmouth MA (41.551115°N,
-70.619438°E)
and passed through a 335 µm Nytex mesh to
remove large organisms and particles.
Three liters of Siders Pond water was added to duplicate
chemostats at approximately 16:30 and placed in a dark growth chamber
at 25°C.
Medium flow turned on at 14:39 6-Feb-2019 (t = 1.61 d)
at a flow rate of 3.0 L d-1 or a dilution rate of 1.0 d-1.
Also, placement of DO probe in MC1 was corrected.
Biofilm growing on DO probe in MC1, which is the cause of the low
DO readings. Biofilm was removed and also removed from chemostat
wall at 9:20 11-Feb-2019 (t = 6.40 d).
New Nafion gas dryer from Perma Pure installed (MD-070-24P-2) at 18:10 14-Feb-2019 (t = 9.76 d).
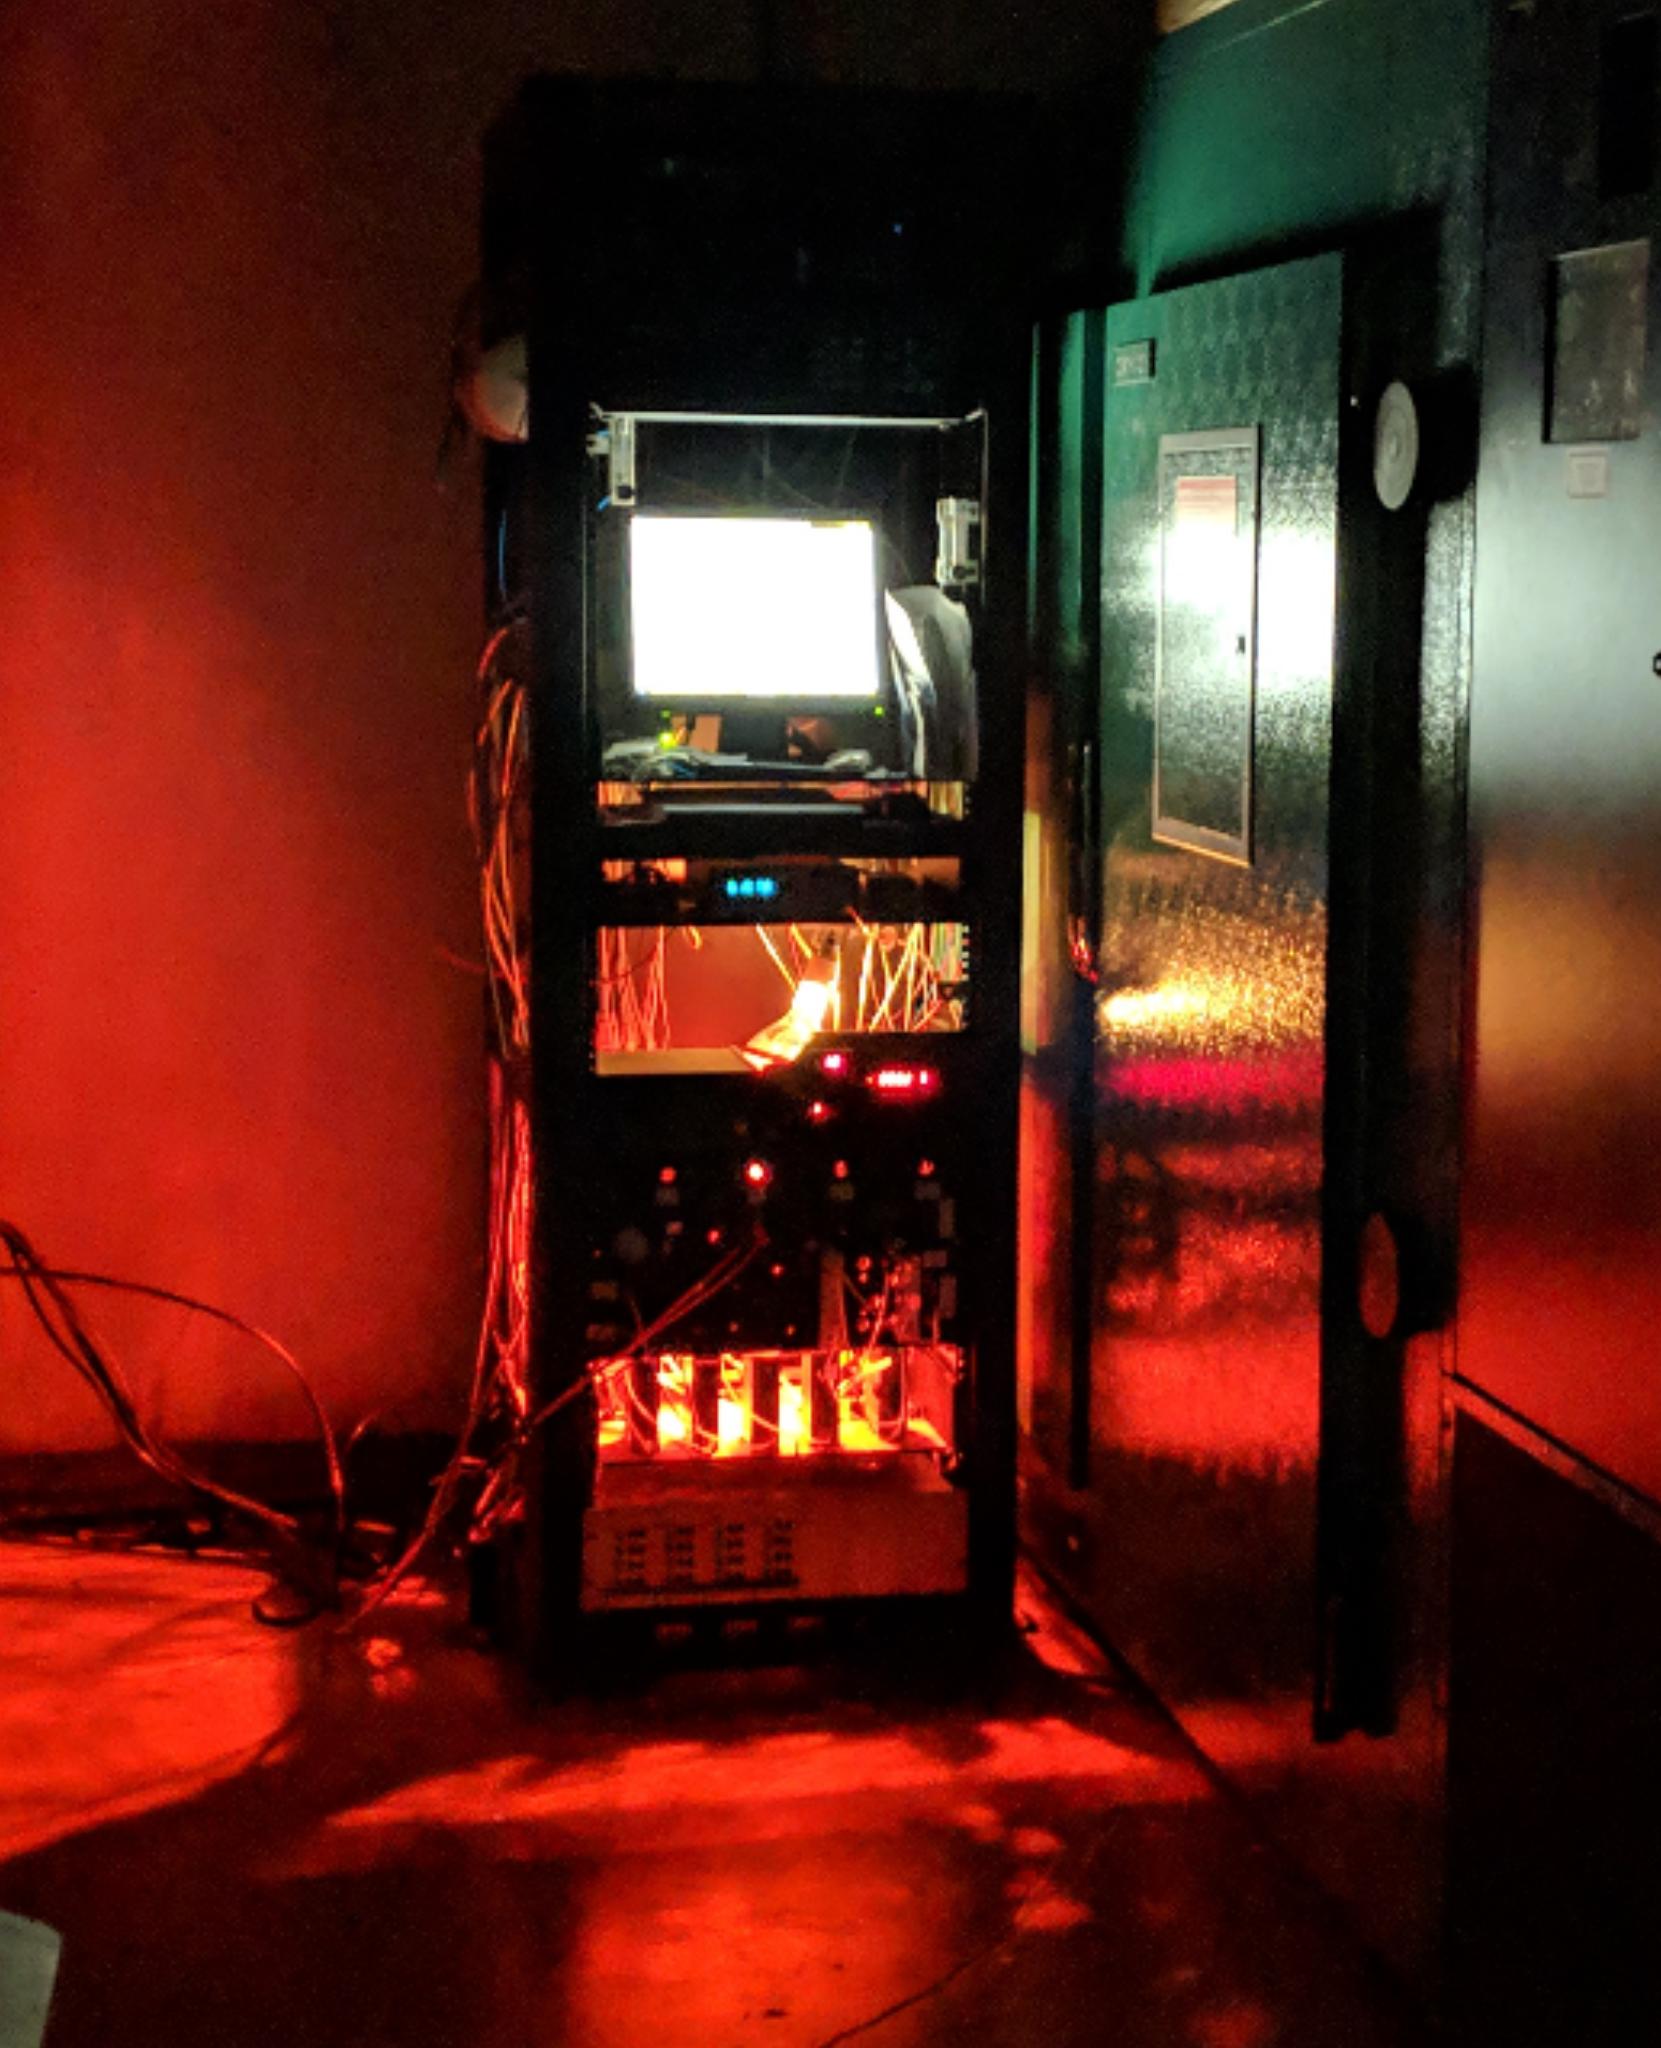
Numerous modifications made: 1) Infrared heater added to gas
handling equipment to minimize condensation in gas streams (see Photos),
2) medium
feed to MC 1 interrupted for 12-24 hrs, 3) headspace exposed to
atmosphere to install new medium feeding approach, 4) removed
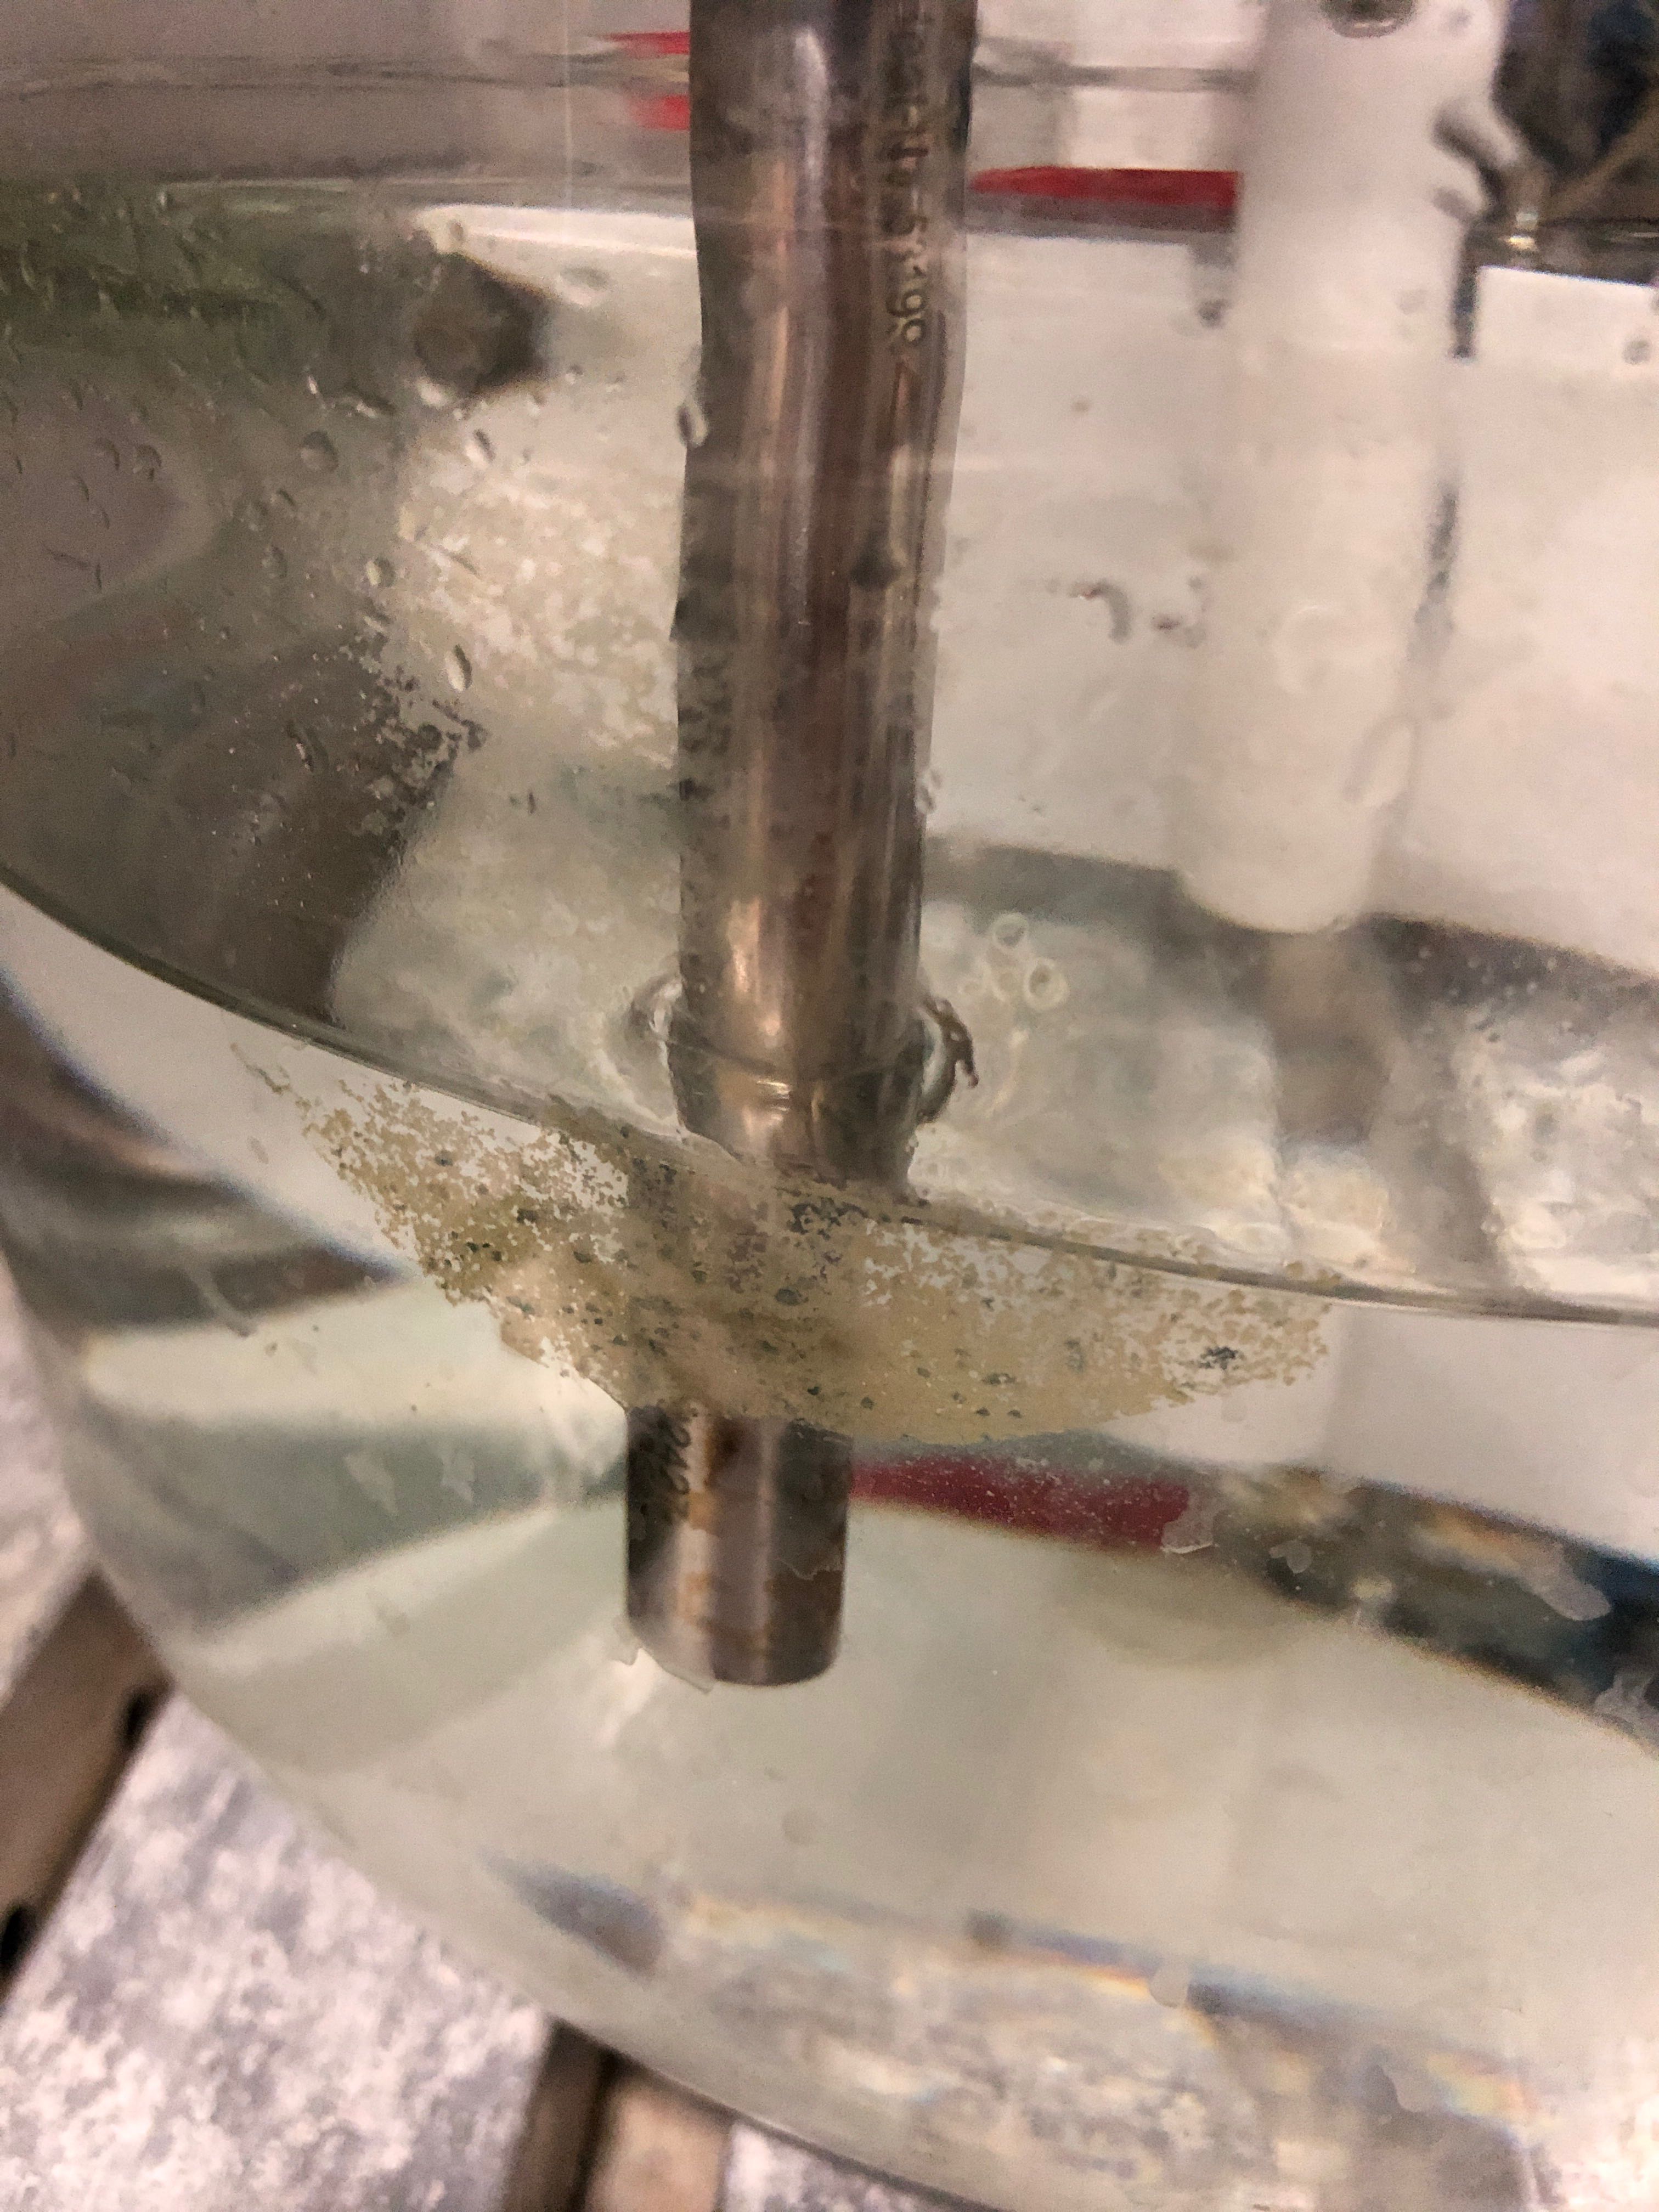
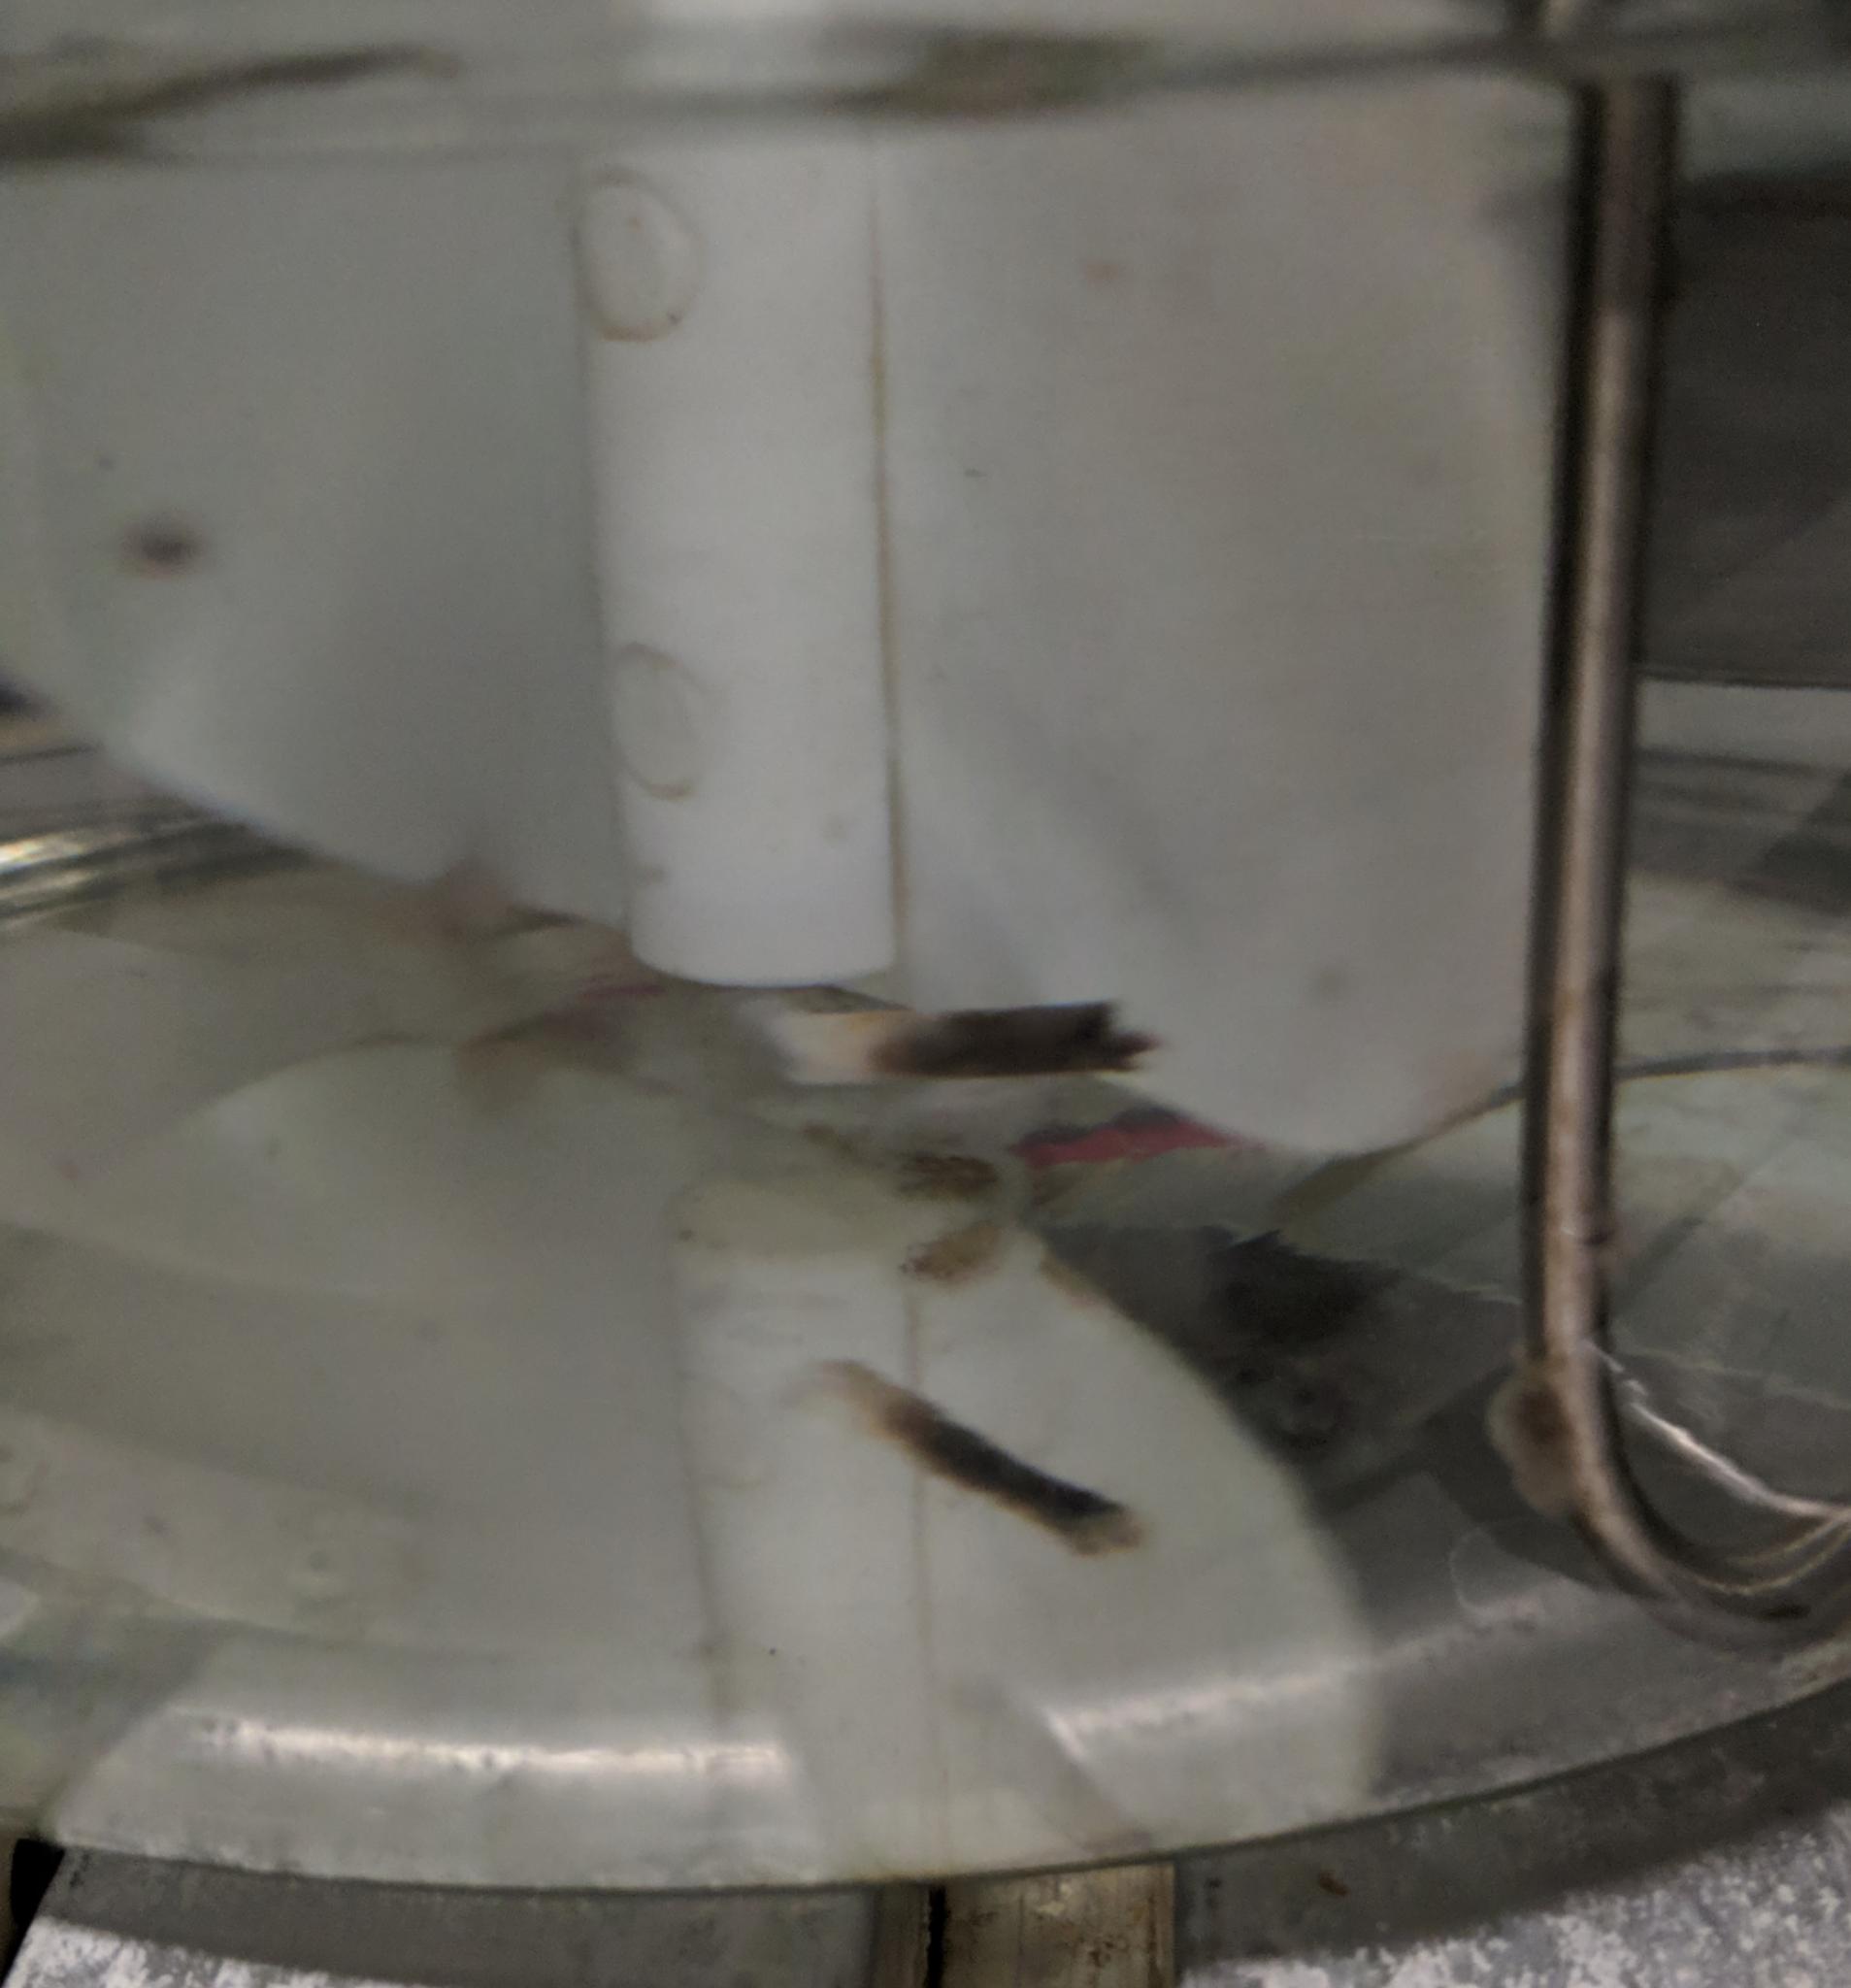
"cigarette butt" from MC1 (also see Photos),
5) ~3 m of Norprene tubing between SS drum (containing inorganic
nutrient medium) and growth chamber was replaced with 1/4" SS tubing to
minimize light input, 6) 1 L from each MC
was cross inoculated to the other to insure similar community
composition
after perturbations (15-Feb-2019, t = 10.77 d).
Analog channel of DO probe in MC1 magically working again (12:56
17-Feb-2019, t = 12.93 d).
Biofilm developing on DO probe in MC1 was removed (10:00
19-Feb-2019, t = 14.42 d).
Nutrient medium not flowing properly, but clearer at 12:00
25-Feb-2019 (t = 20.5 d).
Microbial respiration probably limited by N and/or P, so started
test with modified nutrient medium, raising HNO3 from 15 to
136 µM and H3PO4 from 2 to 21.2 µM at 18:30
25-Feb-2019 (t = 20.77 d).
Feed to chemostats has stopped at around 18:30 28-Feb-2019 (t =
23.77 d) as we spin down Exp. 2. As the last 3 days have shown,
the nutrient medium was deficient in N and P. We will be
repeating this experiment as Exp. 3, but with elevated HNO3
and H3PO4 concentrations.
Data Files:
Primary gas and probe data: Exp2.dat
External variable values: Exp2.oc
Experimental info file: Exp2.info
Compiled high resolution data from DO and pH probes: Exp2_DOpH.csv
Higher resolution (10
min) probe data from Hamilton's RS485 ModBus (files updated here every
1 hr): (Note, these data are now plotted on the JS Graphics page)
The microcosms are sparged with air in a Conviron PGR15 environmental
chamber that is currently operated at 25 ºC. A
closed gas sampling loop regulated at a flow rate of 270 mL/min by a Hargraves
mini pump
(B.1F15E4.A12VDC) delivers reactor headspace gas to analyzer.Sample
loop has an approximate volume of 20 mL. A Masterflex L/S Digital drive
connected to Easy-Load
3 peristaltic pump heads provides exchange flow between
reactors.
Software
Program for monitoring instruments and control. Note, software makes
use of Intel Visual Fortran's serial IO library:
"Fixed" condensation in gas handling system components and lines:
"Cigarette butt" in MC1. Biomass formation/wad (formed in just
~10 days) within 1/4" SS tubing feeding chemostat right after carbon
and nutrient media mix, thereby plugging line. Returned to
previous approach (Exp. 1)
where each were added to chemostat via separate tubes.