This is similar to Exp 3, except we are running
6 chemostats simulaneously, where MC1 (called MC1-C12) is the control
with no 13C
labels and the next
five chemostats (MC2,..., MC6) each have one of the five substrates
(Methanol, MC2-Met; Ethanol, MC3-Eth; Acetate, MC4-Ace; Glucose,
MC5-Glu; Xylose, MC6-Xyl) replaced with its 13C
equivalent. Chemostat operation has also changed, in that we will start
the experiment with 13C-labeled substrates (one substrate
labeled in each MC) and follow 13C
inclusion into the food web during batch phase (no media flow). Once
the batch phase has finished (about 1 week), chemostat operation will
begin, but the media will contain no 13C-labeled substrates
so that the heavy isotope will be washed out. After approximately 10
days, we will switch to the media with individually 13C-labeled
substrates and follow their inclusion into the food web under chemostat
conditions at a dilution rate of 1 d-1.
This single experiment will allows us to track how the food web
functions under both transient (batch) and steady state (chemostat)
conditions.
As bacteria consume the substrates with heavy isotopes, as well as
their predators (such as
protists, viruses and other bacteria) that consume the enriched
bacteria, their RNA will become enriched with 13C and
detectable using stable isotope probing techniques (also see Fortunato
and Huber 2016). Experimental data collected during Exp
4 will be used to
determine the extent of interconnectivity within microbial communities.
Experimental clock time started at 00:00 1-Apr-2022; however,
all six chemostats
were filled with 2.3 L of artificial media containing 13C-labeled
substrates
and inoculated with 600 mL of Siders Pond water at 13:00.
Siders Pond surface water was collected on 31-Mar-2022 at 9:30 and
passed through a 425 µm stainless steel sieve (#40). Water salinity was
3.8 and was acclimated from 8.39ºC to 20ºC over 36 hrs while being bubbled with air. The pH after acclimation was 7.7. All
times are in EDT.
Note:
Only MC2 and MC5 have DO
and pH probes installed. Furthermore, the DO and pH data below are from
the analog output of the probes, which can be offset from true
values or missing. The true digital DO
and pH data collected over ModBus is given in the link below, and the
graph of these data can
be found on the JS Graphics page.
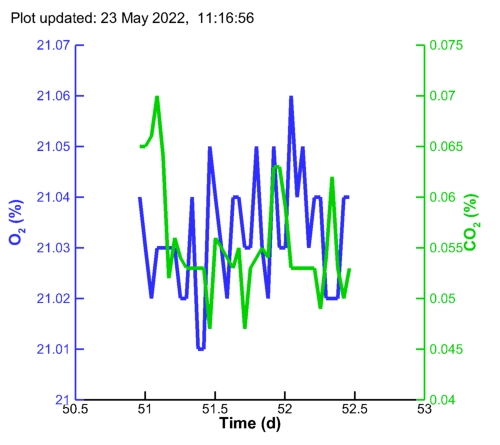
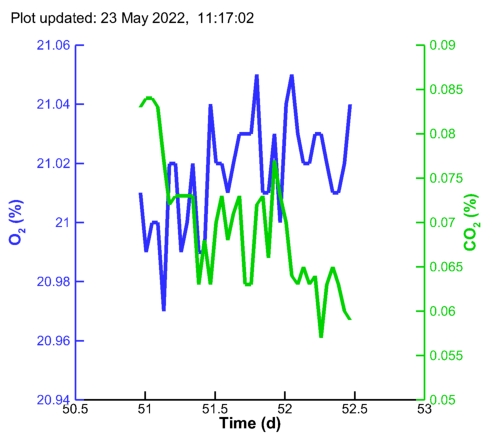
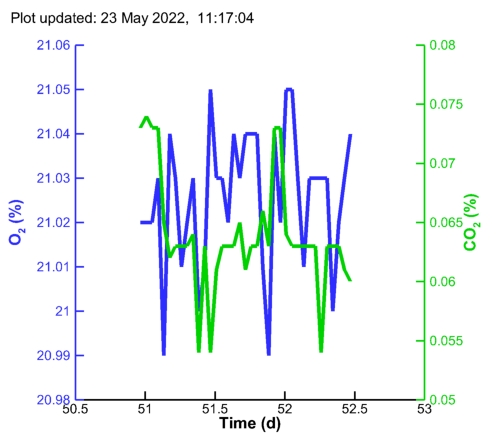
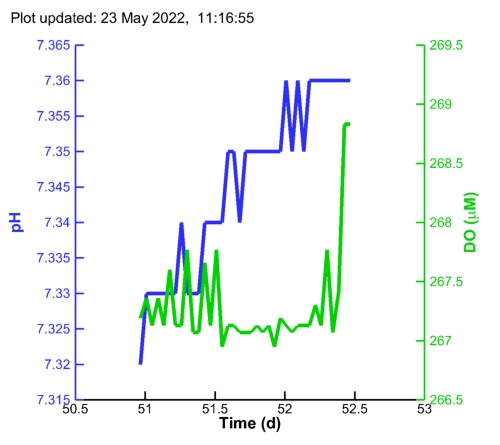
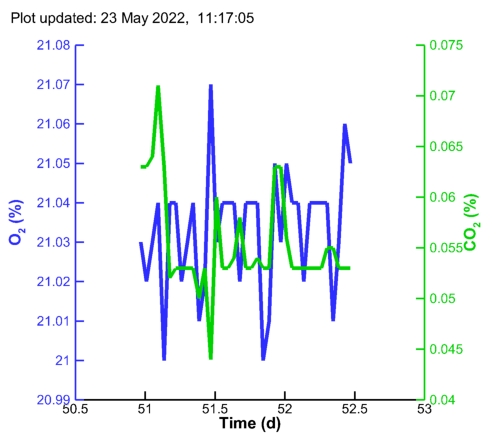
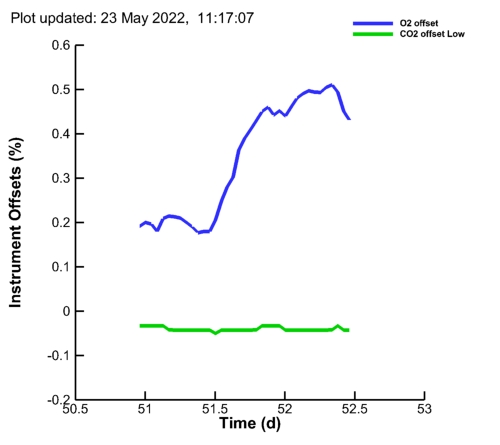
On-line variables associated with MC1-12C Control (last
36 points):
At 9:30 EDT 31-Mar-2022, a 20 L surface water sample was collected
from the surface of Siders Pond,
Falmouth MA (41.551115°N,
-70.619438°E)
and passed through a 425 µm stainless steel sieve (#40) to
remove large organisms and particles. At time of sampling, water
salinity was 3.8 PSU and temperature was 8.39ºC. The 20 L carboy was
placed in growth chamber and allowed to acclimate to 20ºC while being
bubbled with air.
All 6 microcosms where inoculated with 600 mL of acclimated
Siders Pond water at 13:00 1-Apr-2021 (or t = 0.54 d). This marks the start of Exp. 4.
Due to sample withdrawals, and batch operation, the media level
in the bioreactors was below the level of the DO probes from day 1.53
until they were lowered back into the culture media at day 2.49.
pH
Probe in MC 5 was exposed to air from t = 4.55 d (13:28 5-Apr-2022)
until t = 5.37 d (9:08 6-Apr-2022) due to drop in medium volume from
sampling chemostat.
6-Apr-2022 10:13 (t = 5.43 d): Microcosms have been sample each
day following inoculation on 1-Apr-2022. Current volume of reactors is
approximately 1 to 1.4 L.
Chemostat operation started at t = 5.737 d (17:41 6-Apr-2022) at a dilution rate of 1 d-1 (3 L d-1).
11:30 14-Apr-2022 (t = 13.47 d). Air entrainment into the ASW pump tubing connector was identified,
which resulted in lower flow and dilution rate to the chemostats than
desired. This may have started around day 7.5, but timing is uncertain.
This was repaired on 13-Apr-2022 (t = 12.5). Also, a gas leak was
identified in the headspace gas sampling loop. Some air may have been
entrained into the headspace of the bioreactors during sampling
resulting in slight dilution of the headspace gas concentrations. This
was repaired today (t = 13.50 d). It is uncertain when this began.
Washout of the batch phase 13C labels continues.
13:51 19-Apr-2022 (t = 18.577 d) Chemostat 13C labeling phase of the experiment started. Analysis of PO13C during the washout phase (started at t = 5.737 d) shows del13C effectively back to background levels. For all chemostats except the 12C control (MC1), one of the 5 carbon sources have been replaced with their 13C equivalent. Like the batch phase, we will track the isotopes' incorporation into bacteria, protists and viruses (hopefully).
15:17 20-Apr-2022 (t = 19.637 d) Chemostats returned to 12C substrate feed due to pump failure and pulse of C to system. That pump has been removed from service and will be sledged hammered. Chemostats will again be flushed of 13C labels, and phase III will be attempted again in approximately 5 days.
15:49 24-Apr-2022 (t = 23.6596 d)
Pump problem on MC2 where the Carbon + TE media began dripping into MC2
faster than desired. This resulted in vastly increased respiration for
that MC. Situation was not fixed until 8:45 25-Apr-2022. (t = 24.3646
d).
11:42 26-Apr-2022 (t = 25.4875 d).
Both C+TE and ASW media pumps were stopped for ~2 hours to address pump
issues and replace pump tubing. Flow was resumed at 13:49 (t = 25.57597
d) following pump calibrations. MC2 still recovering for high C dose.
12:53 28-Apr-2022 (t = 27.53712 d) To
insure community diversity between chemostats following several pump
perturbations in the C+TE media feed, 180 mL from each chemostat was
transfer to the other 5 chemostats, so that a total of 900 mL was
removed from each MC and distributed to the other MCs.
14:00 28-Apr-2022 (t = 27.58333 d) In case there was loss of diversity in MCs do to perturbations, 600 mL of Siders Pond water
was added to each MC. The Siders Pond water was collected yesterday
morning (9:00 27-Apr-2022), passed through a 425 µm stainless steel sieve (#40), placed in the growth chamber at 20ºC, and bubbled with air to acclimated the community prior to re-inoculation of each MC.
10:58 4-May-2022 (t = 33.45715 d) Chemostat 13C labeling phase of the experiment has restarted. The chemostats have been flushed for 13.8 days with 12C substrates prior to change over to individually labeled 13C substrates, except for the control (MC1) that still has only 12C substrates. May the 4th be with us.
12:26 18-May-2022 (t = 47.51825 d) The last samples have been taken from Exp. 4
and media pumps have been switch off. Head space gas sampling and
probes will remain on-line for a few days during the terminal batch
phase of the experiment.
11:30 23-May-2022 (t = 52.458 d) All data collection has stopped and chemostats are being emptied.
Data Files:
Primary gas and probe data: Exp4.dat
External variable values: Exp4.oc
Experimental info file: Exp4.info
Compiled high resolution data from DO and pH probes: Exp4_DOpH.csv
Higher resolution (10
min) probe data from Hamilton's RS485 ModBus (files upload here every
1 hr): (Note, these data are now plotted on the JS Graphics page and the data from all
trace files are collated and available here: Exp4_DOpH.csv)
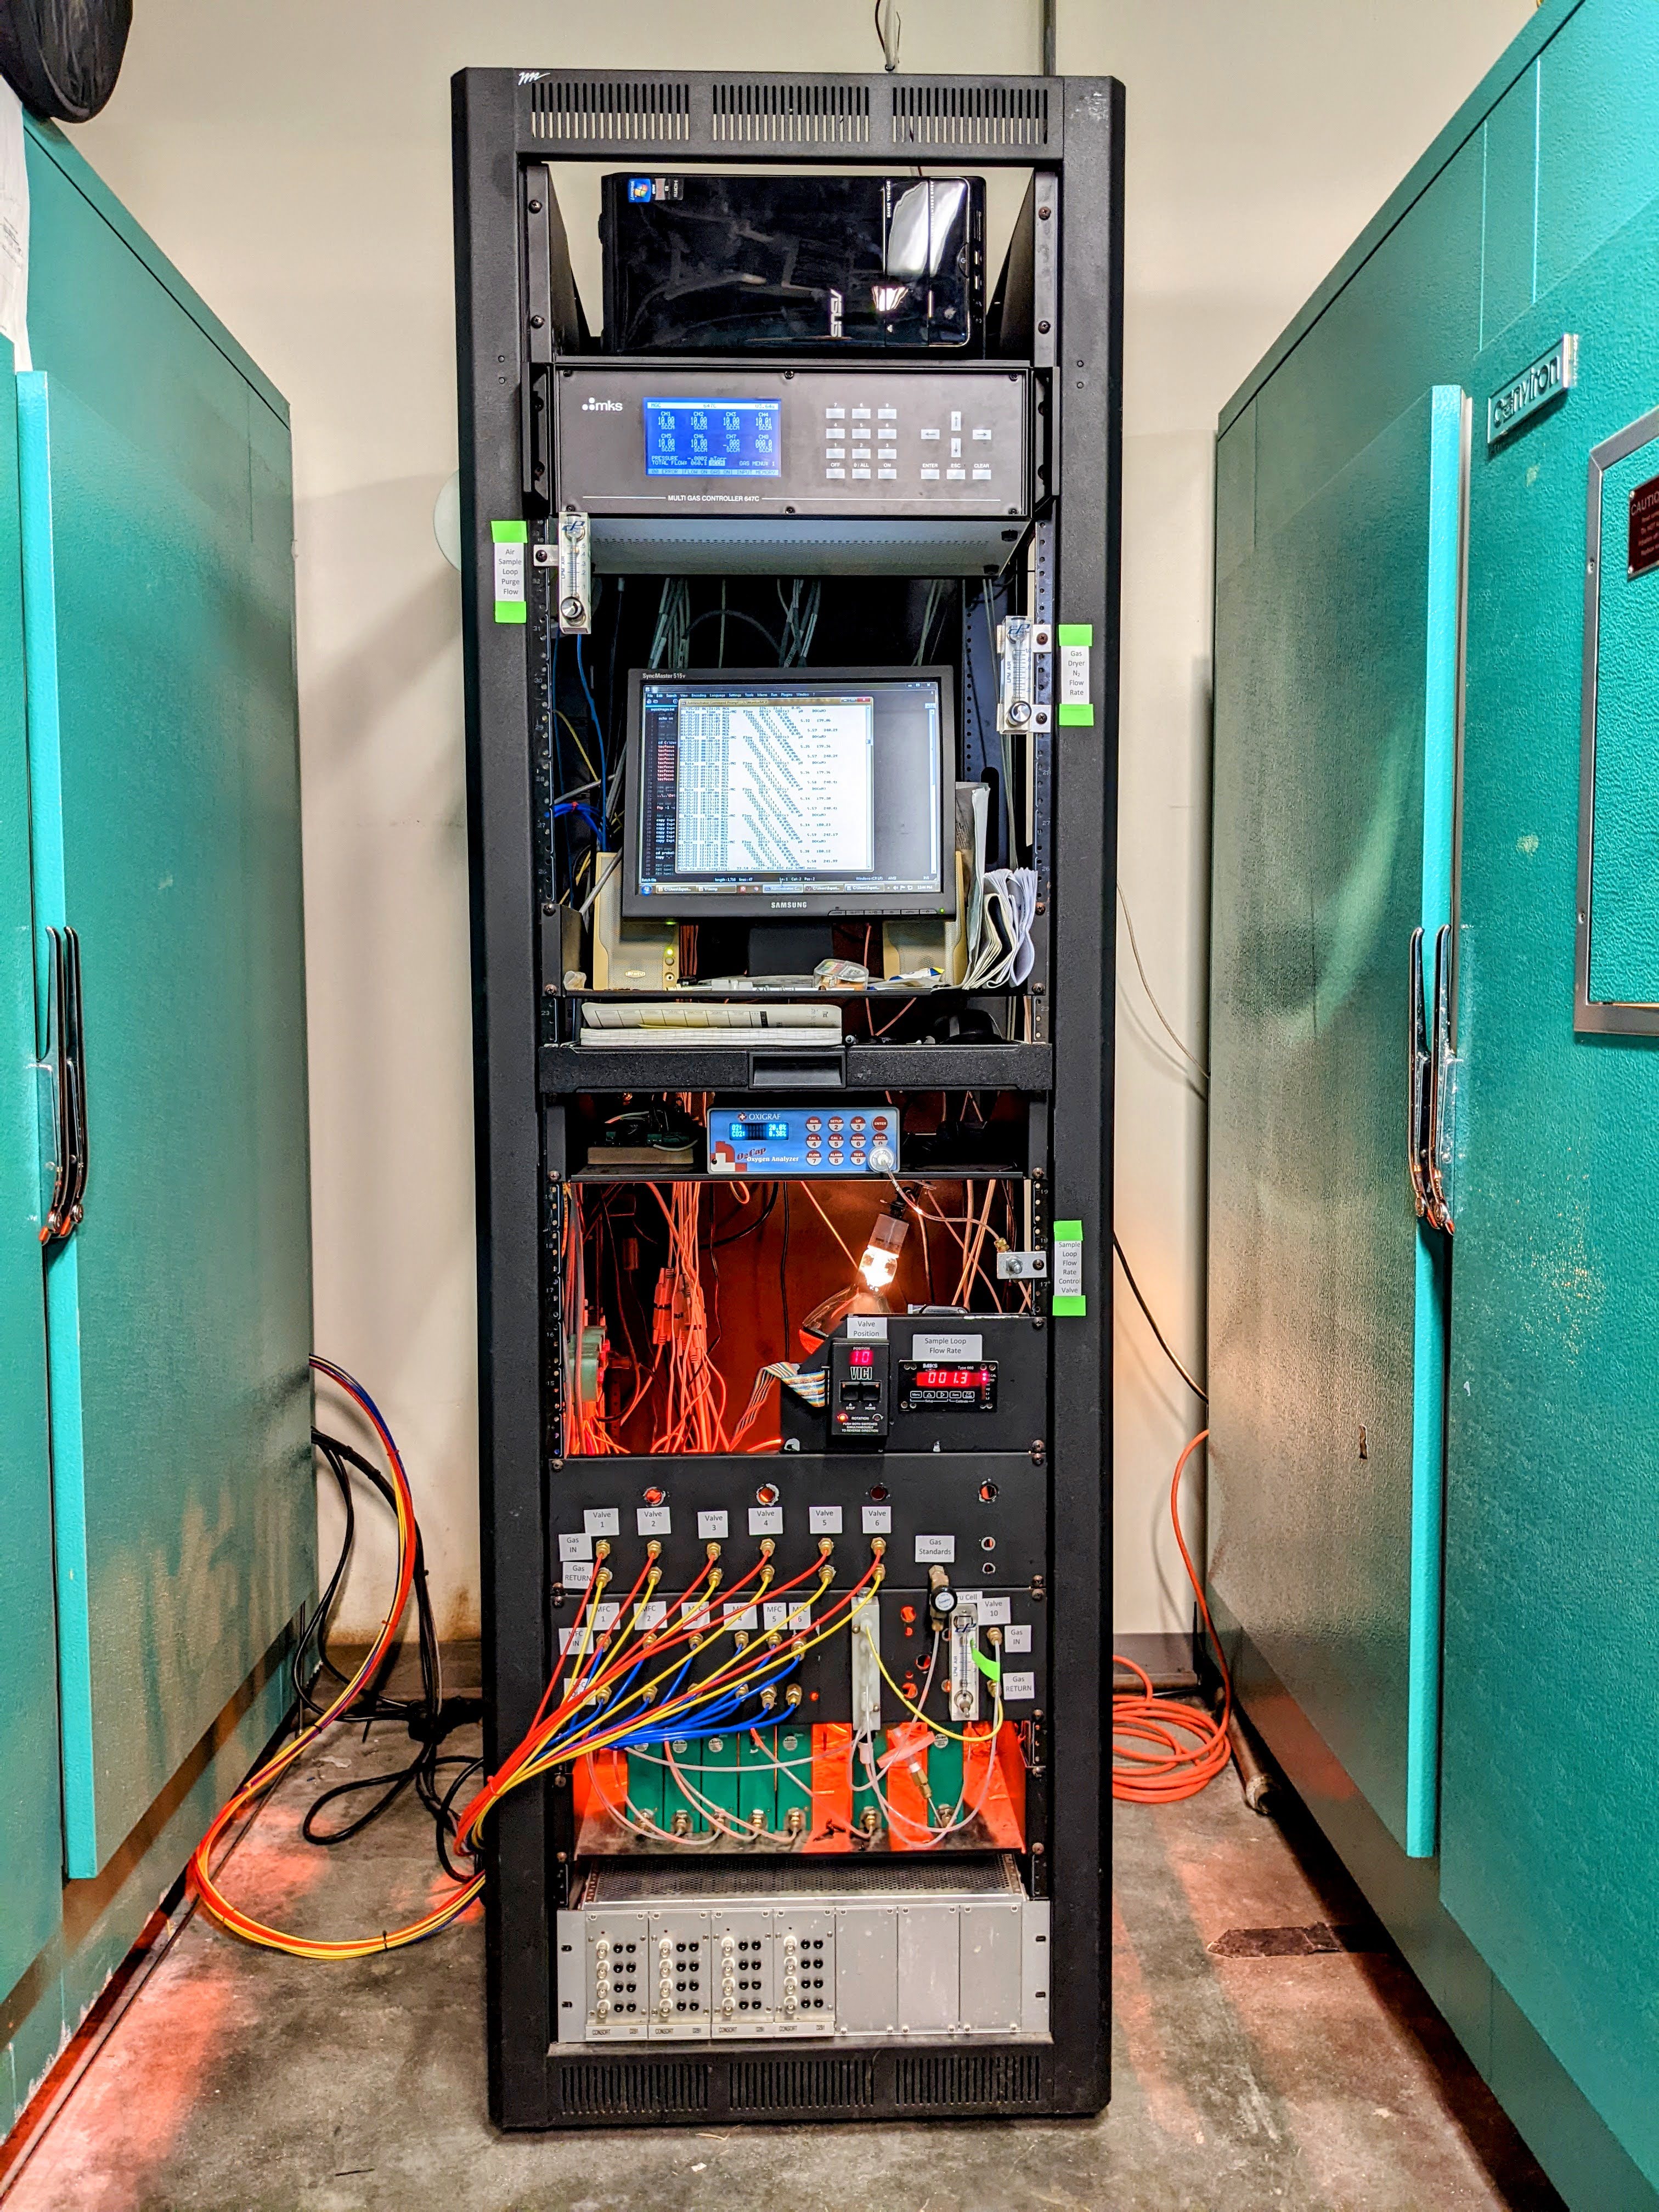
The microcosms are sparged with air at 10 sccm (10.7 mL min-1 at 20ºC) in a Conviron PGR15 environmental
chamber that is currently operated at 20 ºC. A
closed gas sampling loop regulated at a flow rate of 270 mL min-1 by a Hargraves
(now Parker)
mini pump
(B.1F15E4.A12VDC) delivers reactor headspace gas to analyzer.Sample
loop has an approximate volume of ~50 mL. Reactor gas headspace is approximately 4.7 L. A Masterflex L/S Digital drive
connected to Easy-Load
3 and cartridge peristaltic pump heads provides media
flow to and from
bioreactors using various sizes of L/S Tygon A-60-F tubing in the pump heads and Nylochem nylon-12 1/8" tubing for gas an liquid transfers.
Software
Program MonitorMCP is used for monitoring instruments and gas control
while
program datFile2CVS is used to convert *.dat files to *.csv files used
by HighCharts.
Data is collected every hour, backed up to a server,
converted to csv files and copied to web server for near real-time
display here. Note, MonitorMCP makes
use of Intel Visual Fortran's serial IO library for RS232
communication:
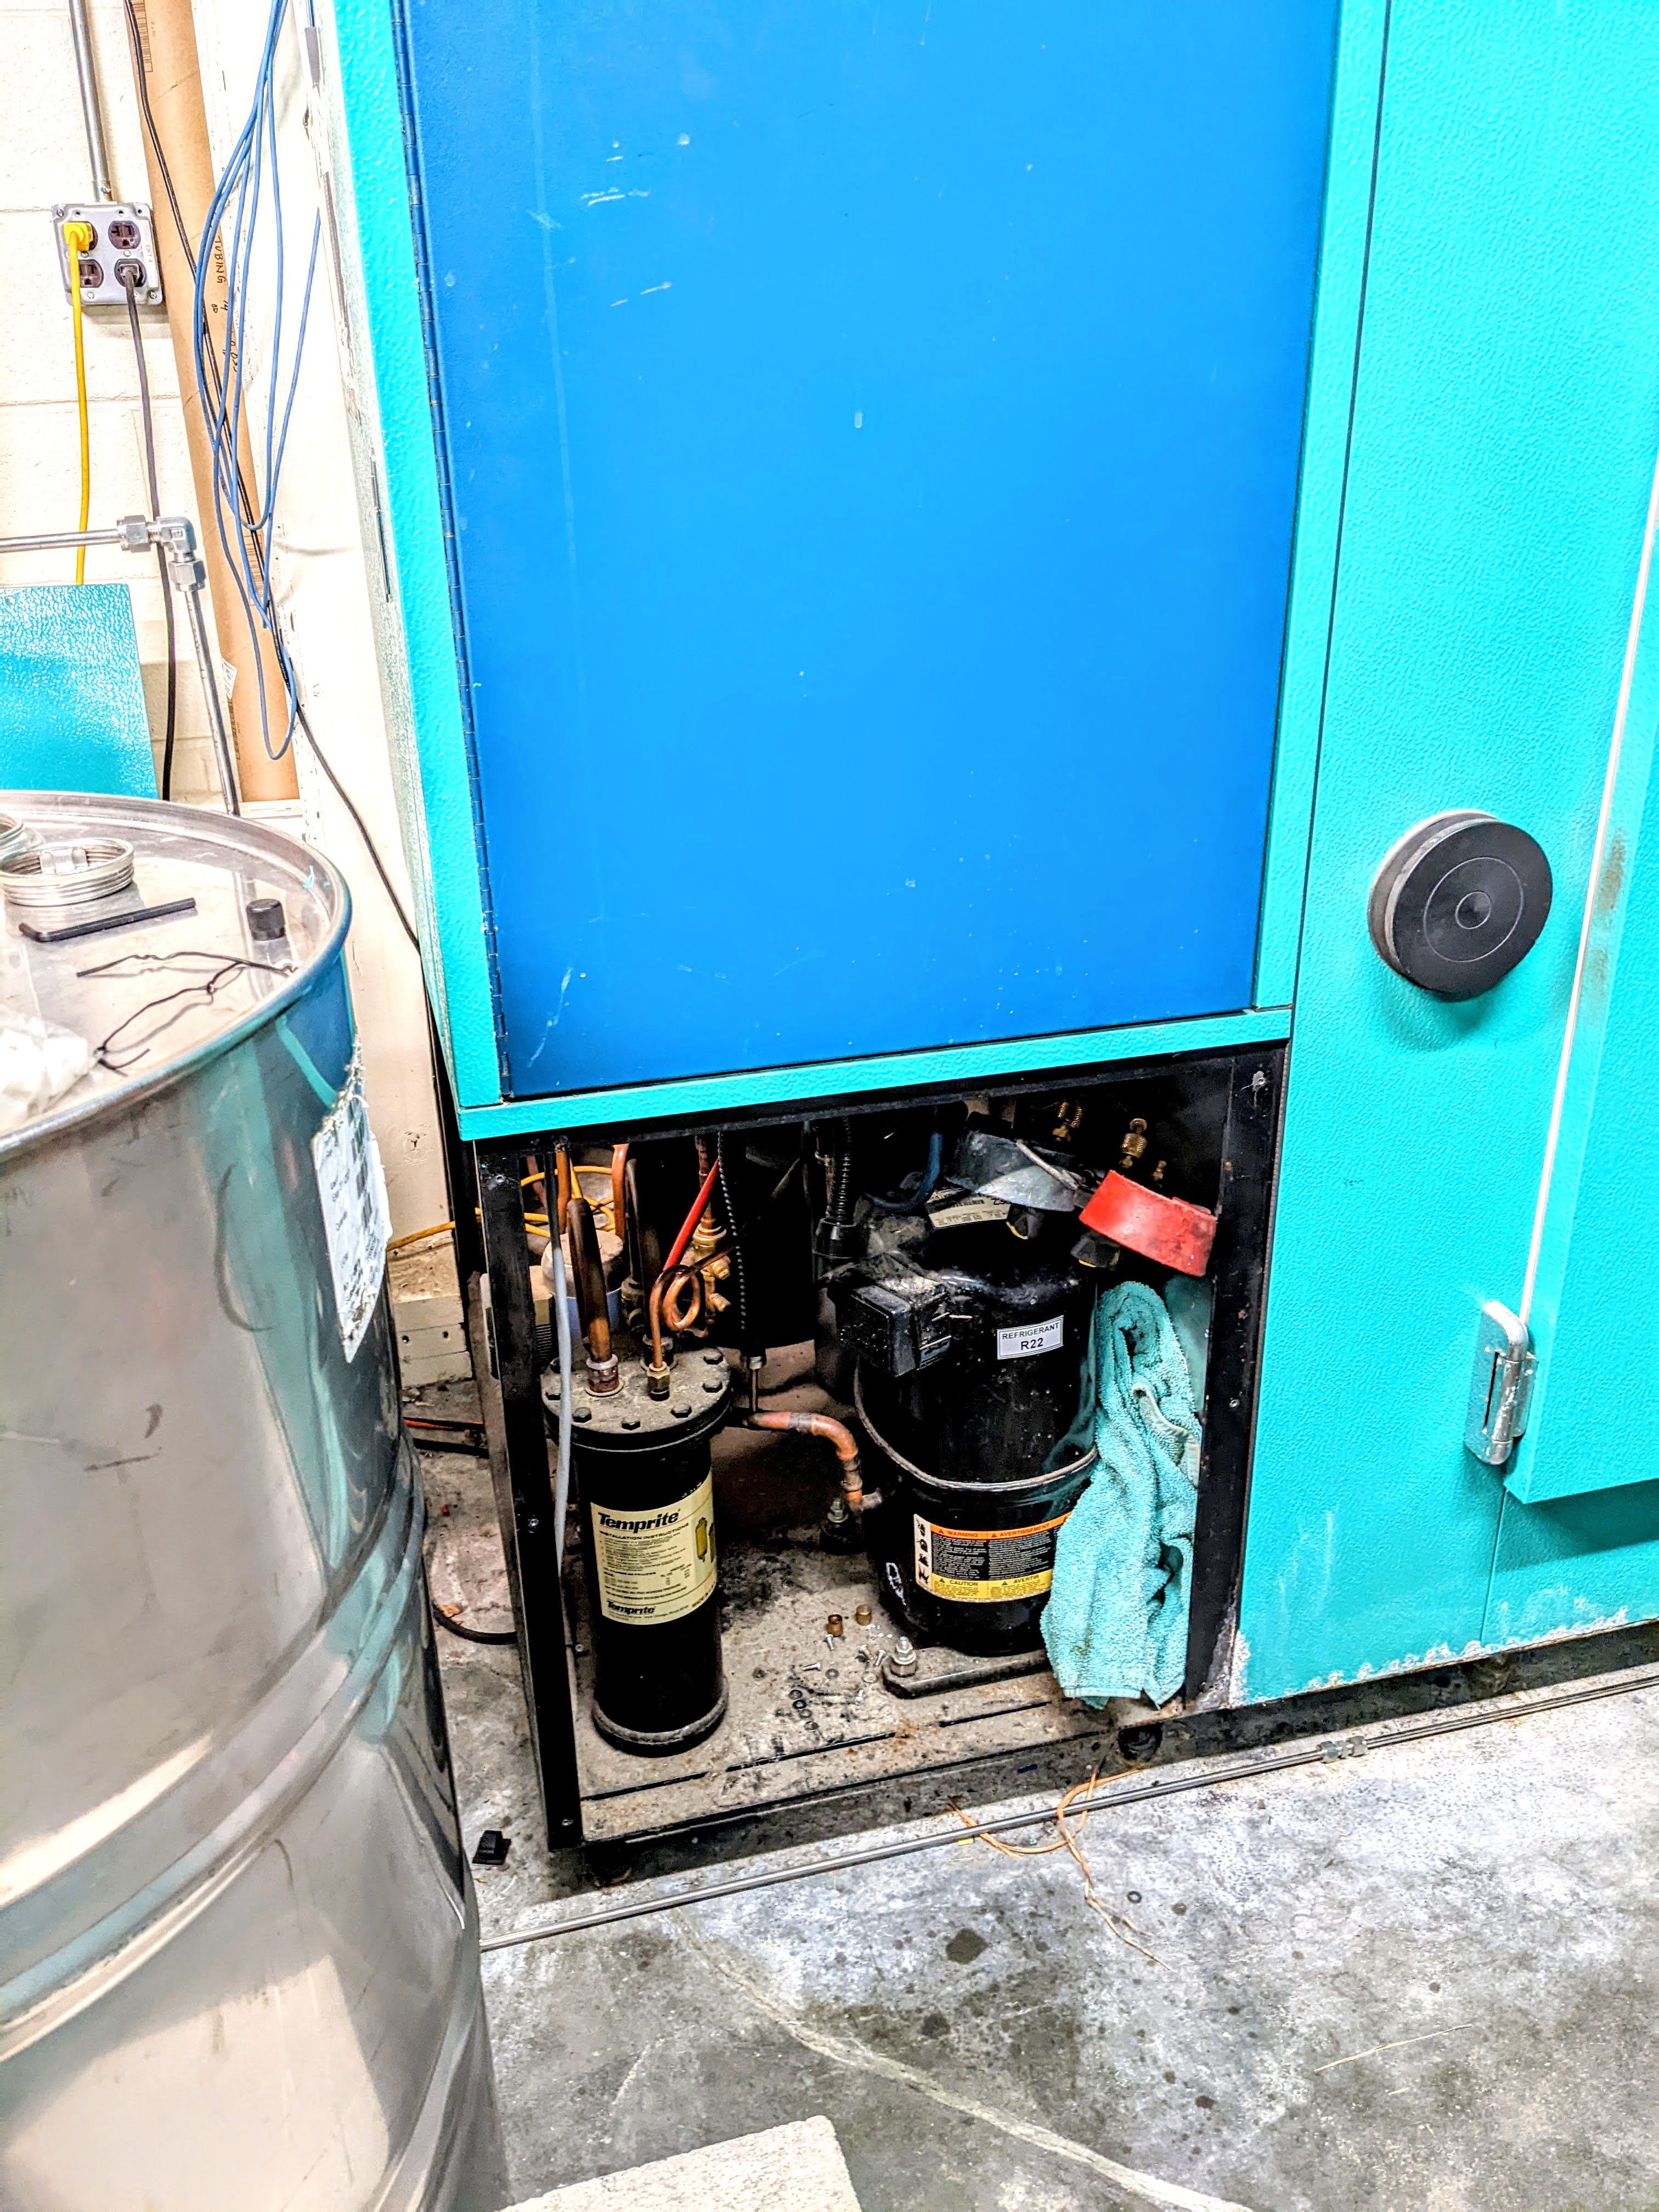
Delay of game. Well, we were
going to start Exp 4 today (29-Mar-2022), but the refrigeration unit
on the growth chamber had other plans. MBL's crack HVAC team is working
on it.
(31-Mar-2022: The growth chamber is back on-line. Thanks Ben!)
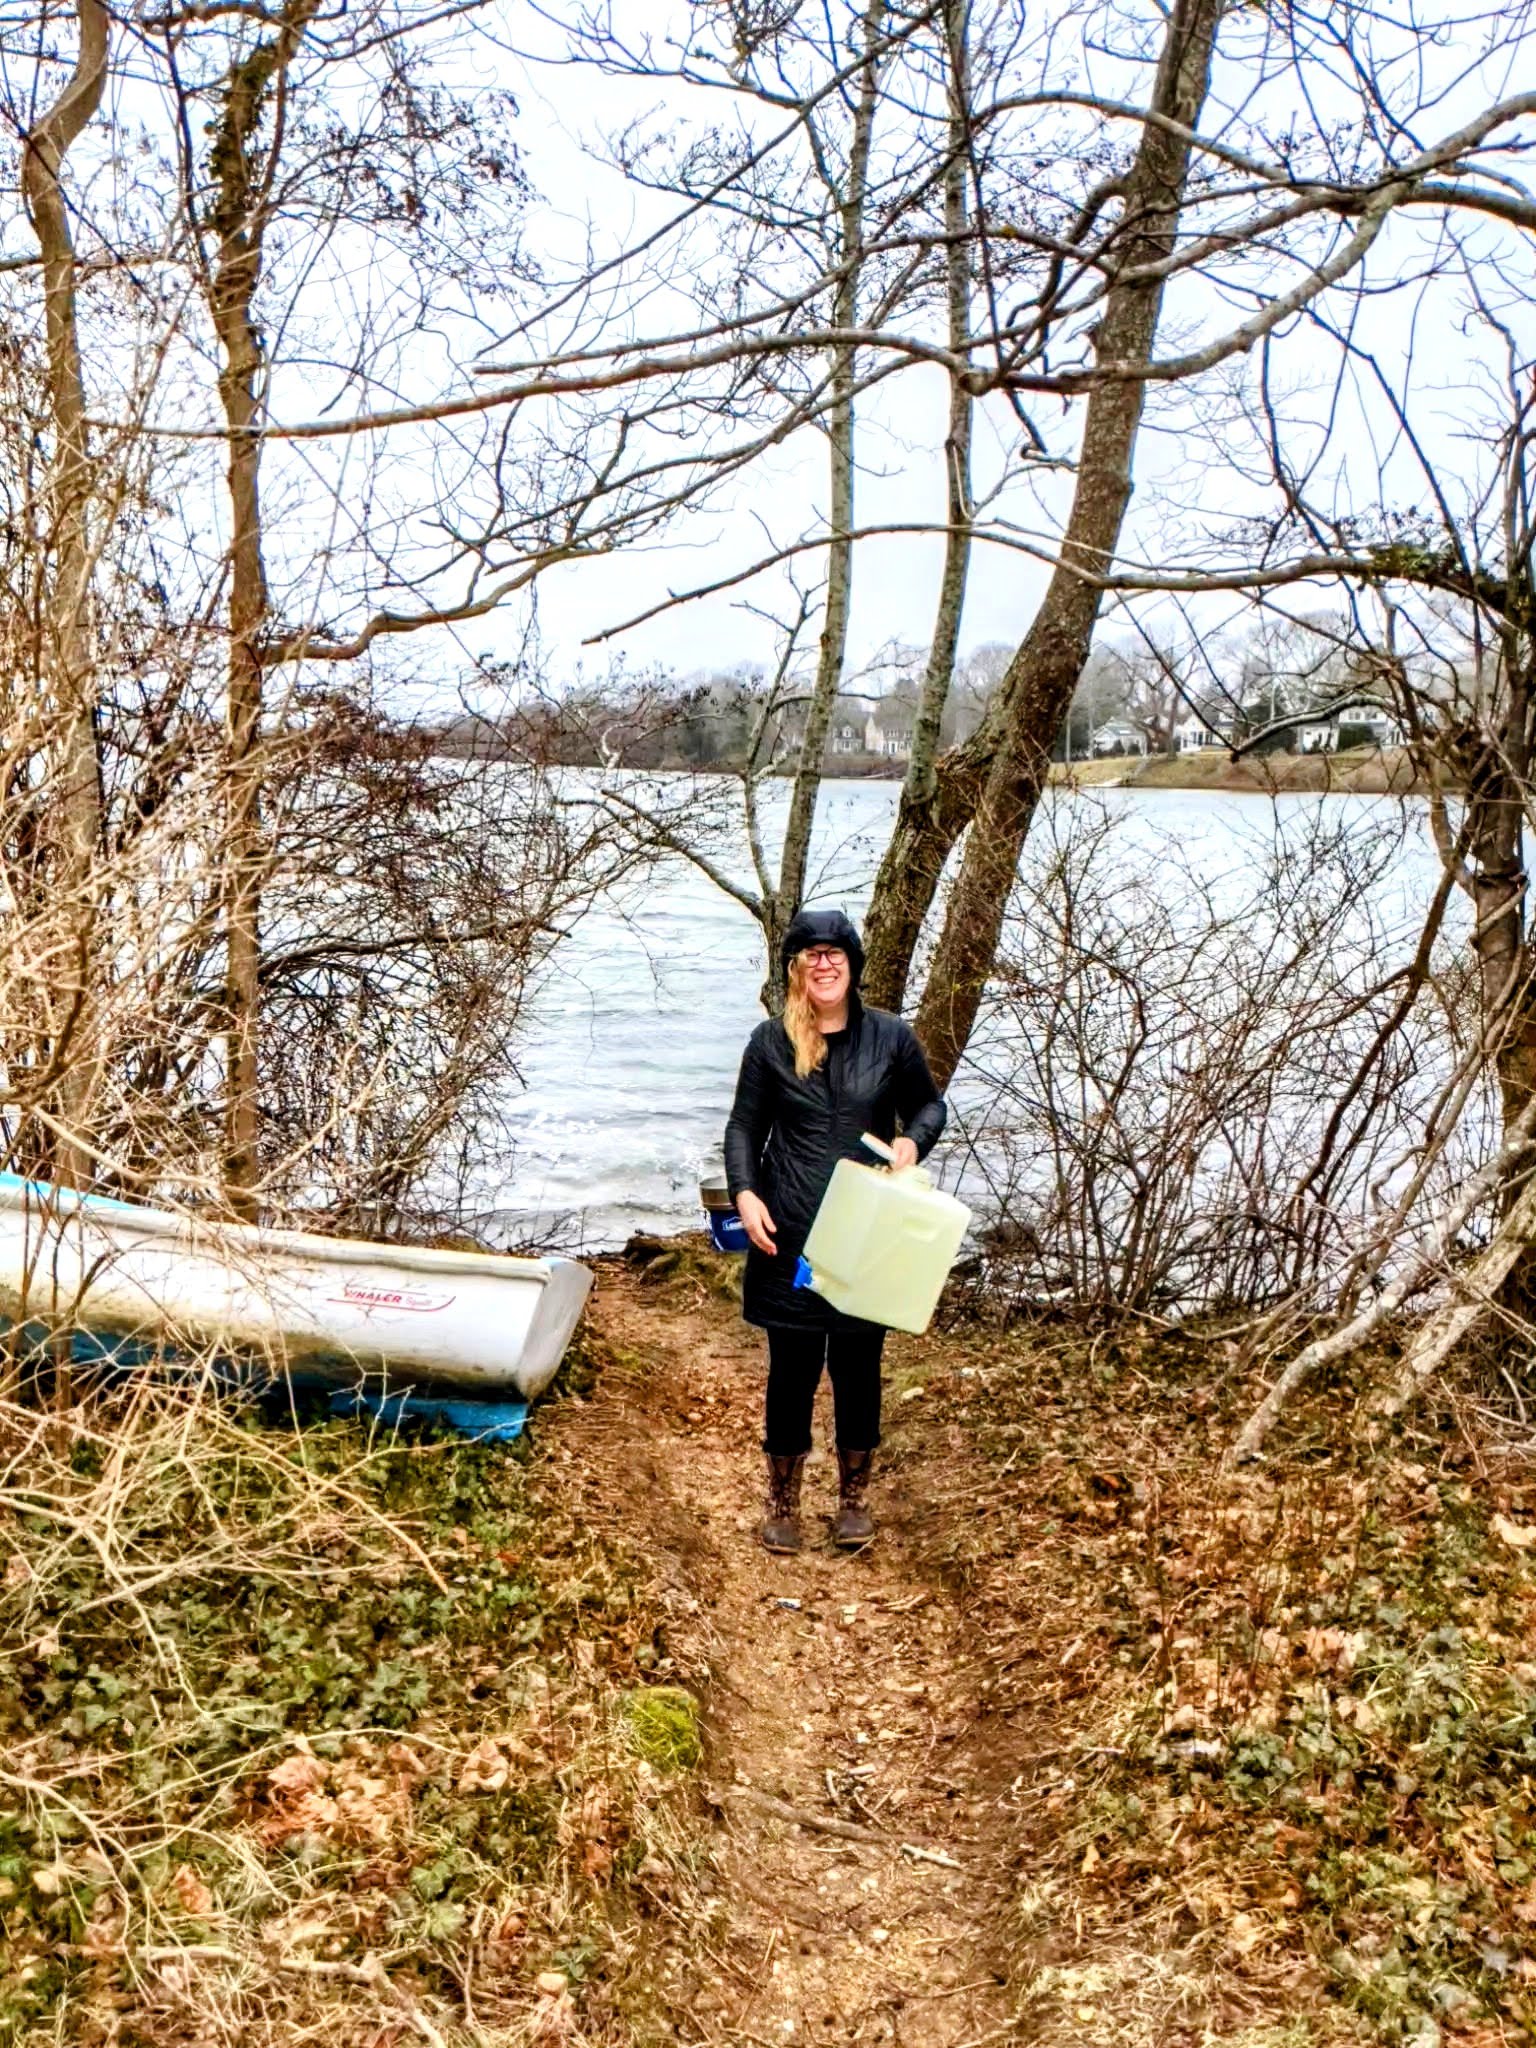
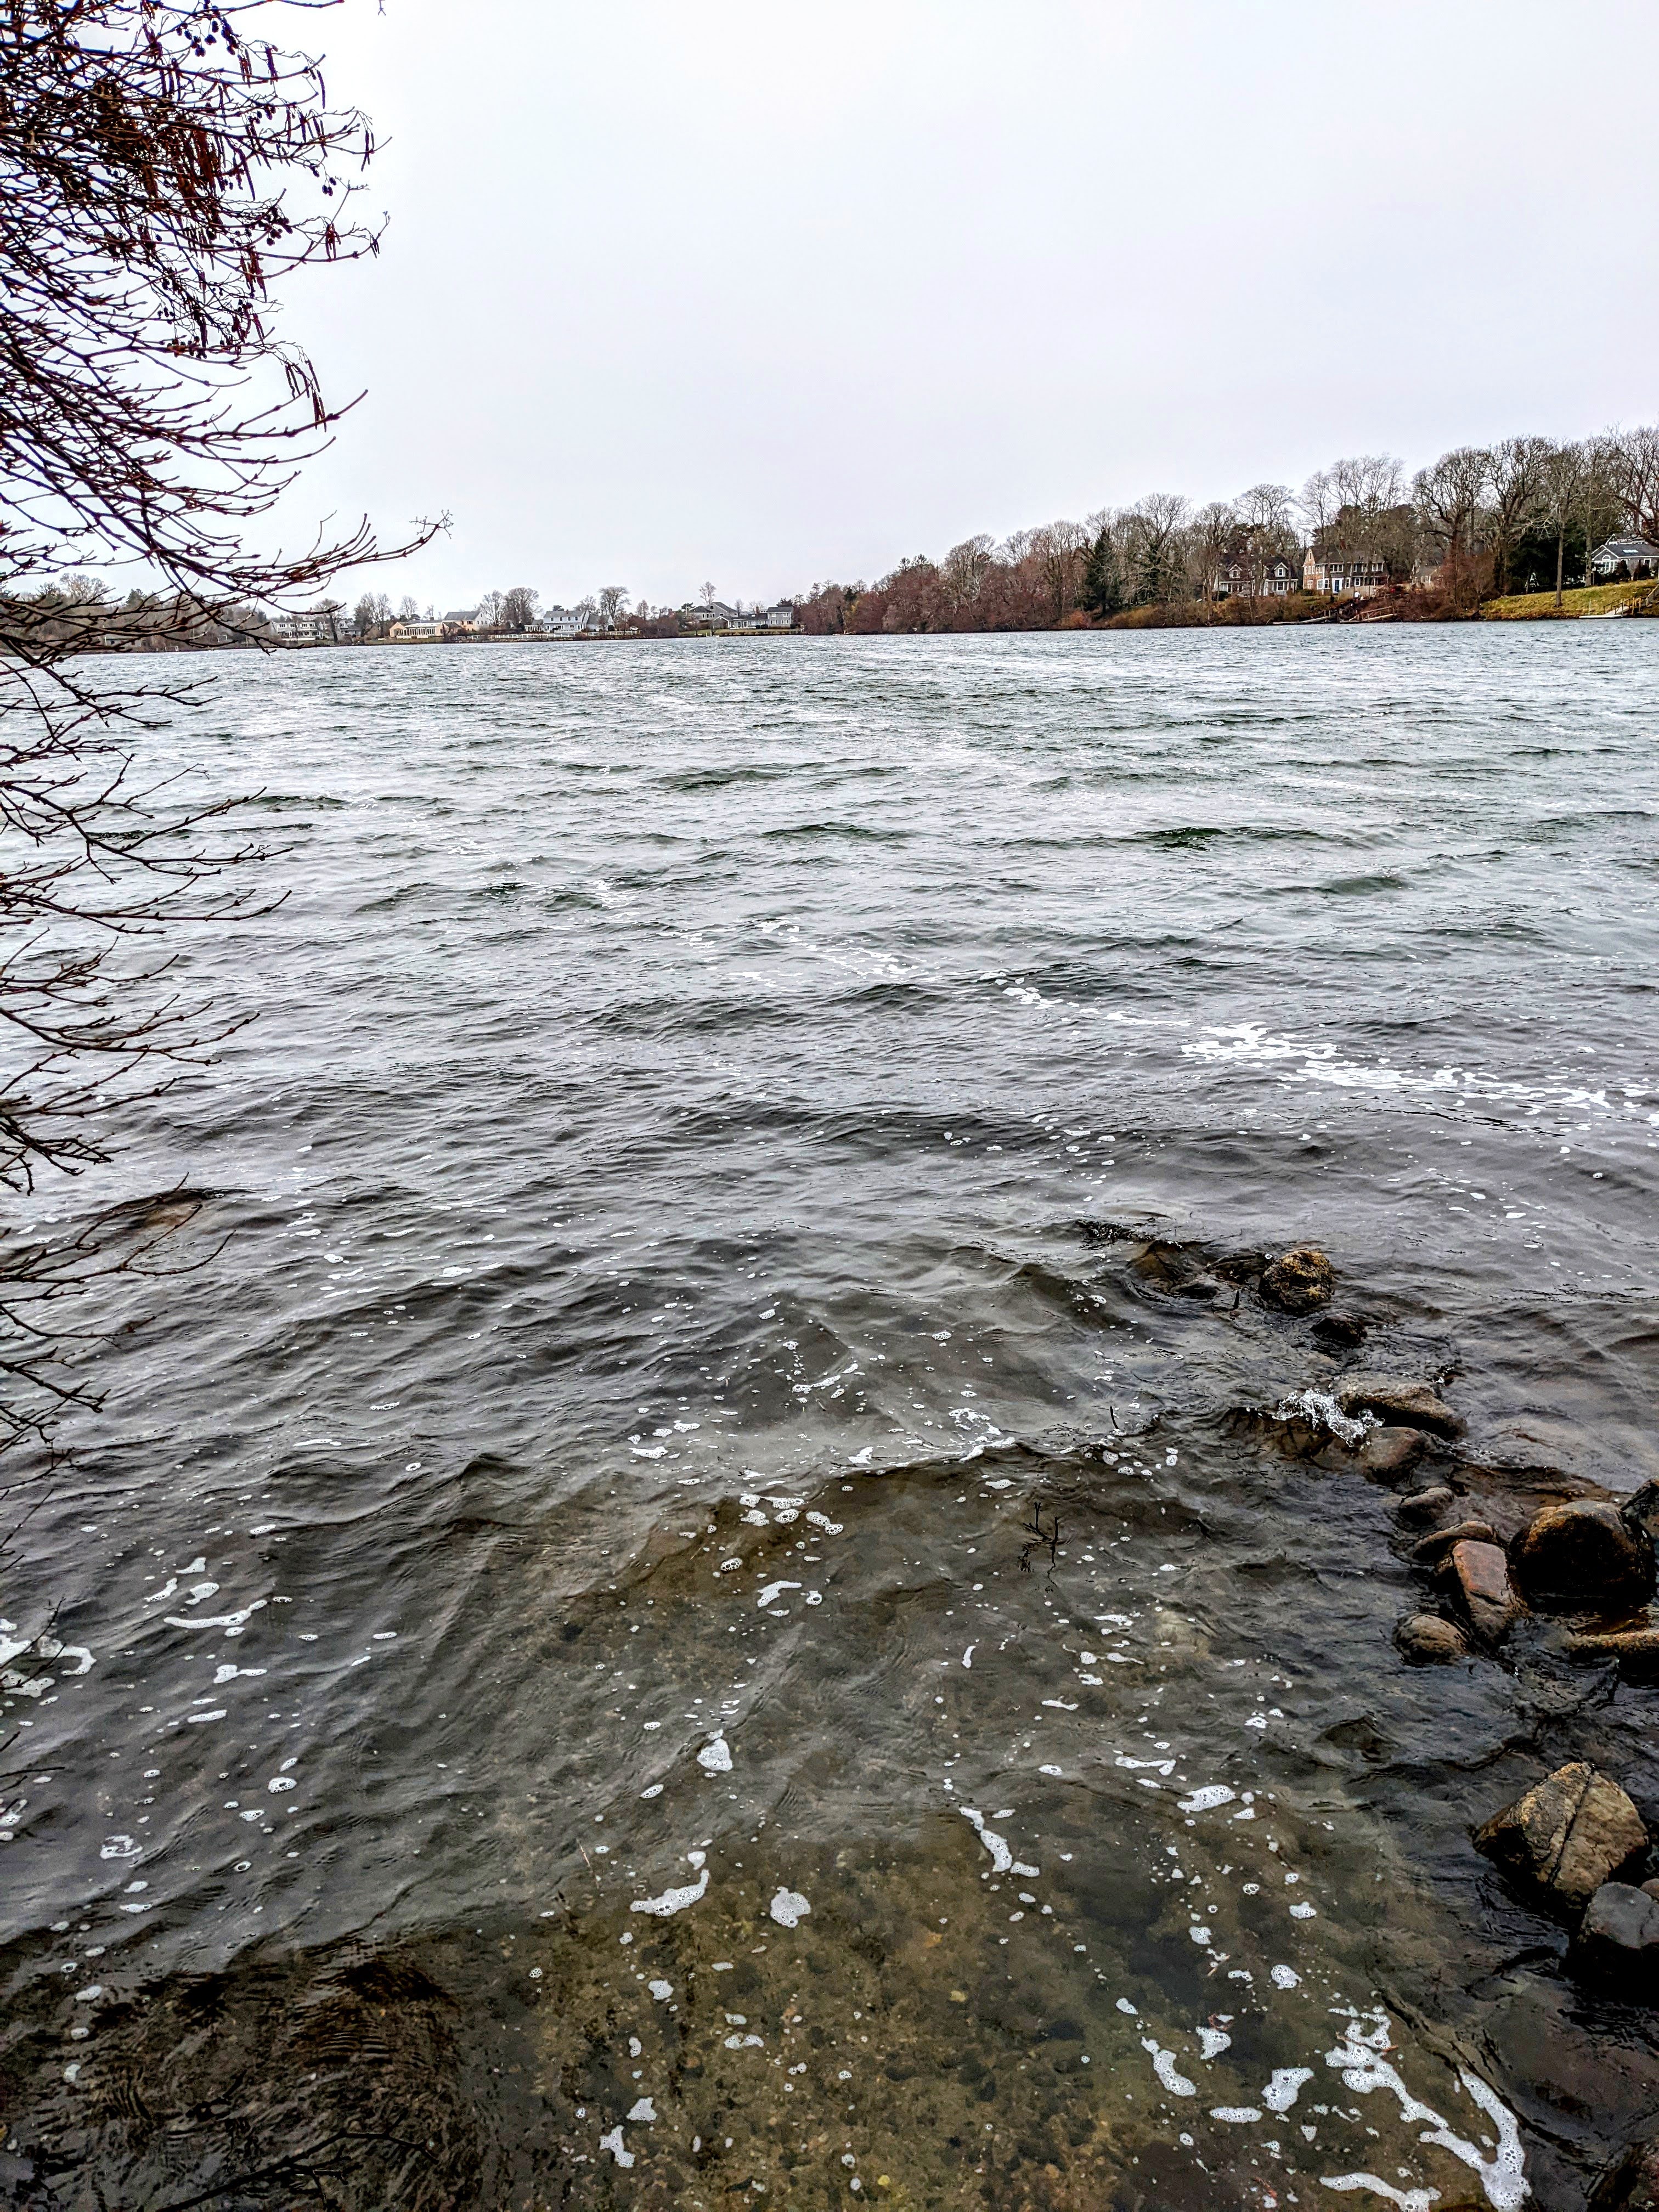
Dr. Ahern collecting water sample from Siders Pond on 31-Mar-2022 for
inoculation of bioreactors. It was a bit windy.