This is basically Exp. 2 restarted with a
modified nutrient
medium. Nitrate has been increased from 15 µM to 136 µM and
phosphate has been increased from 2 µM to 21.2 µM. Also, a more
defined artificial seawater mixture was used to bring salinity to 3
PSU.
In approximately 2 weeks the glucose in the
defined medium will be replaced with 100% 13C-glucose in a
step-up pulse, but the feed medium will otherwise be unchanged.
As bacteria consume the heavy isotope, as well as predators (such as
protists, viruses and other bacteria) that consume the enriched
bacteria, their RNA will become enriched with 13C and
detectable using stable isotope probing techniques (also see Fortunato
and Huber 2016). Experimental data will be used to
determine the extent of interconnectivity within microbial communities.
Experimental clock time started at 00:00 6 Mar 2019; however,
chemostats
were filled with 3 L of Siders Pond water at 11:50, but with medium
feed rate
turned off
to allow the Siders Pond community time to adjust to warm conditions
(25 °C).
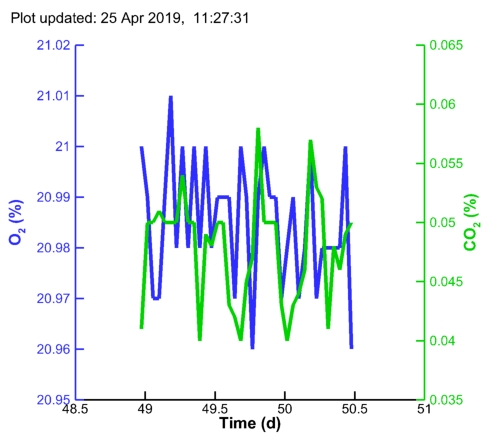
On-line variables associated with MC1 (last
36 points):
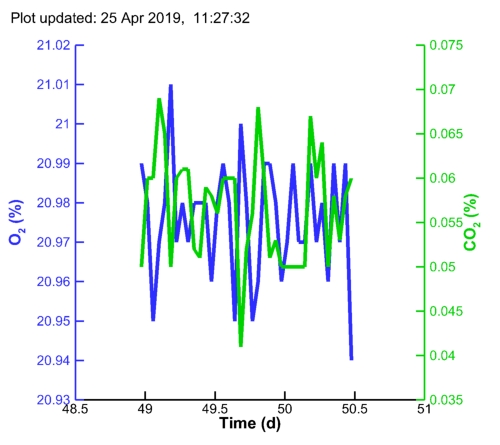
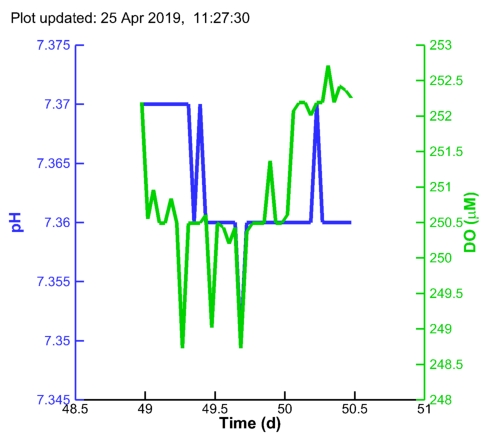
Plot
of O2, CO2 over all time. Plot
of pH and DO over all time. Interactive graphics
are also available under the JavaScript
Graphics
menu item above. Note, the analog output for the DO probe on MC1
is intermittent; however, the Modbus digital output is working fine, so
see the text files below or JavaScript Graphics to check DO.
On-line variables associated with MC2
(Last 36 points):
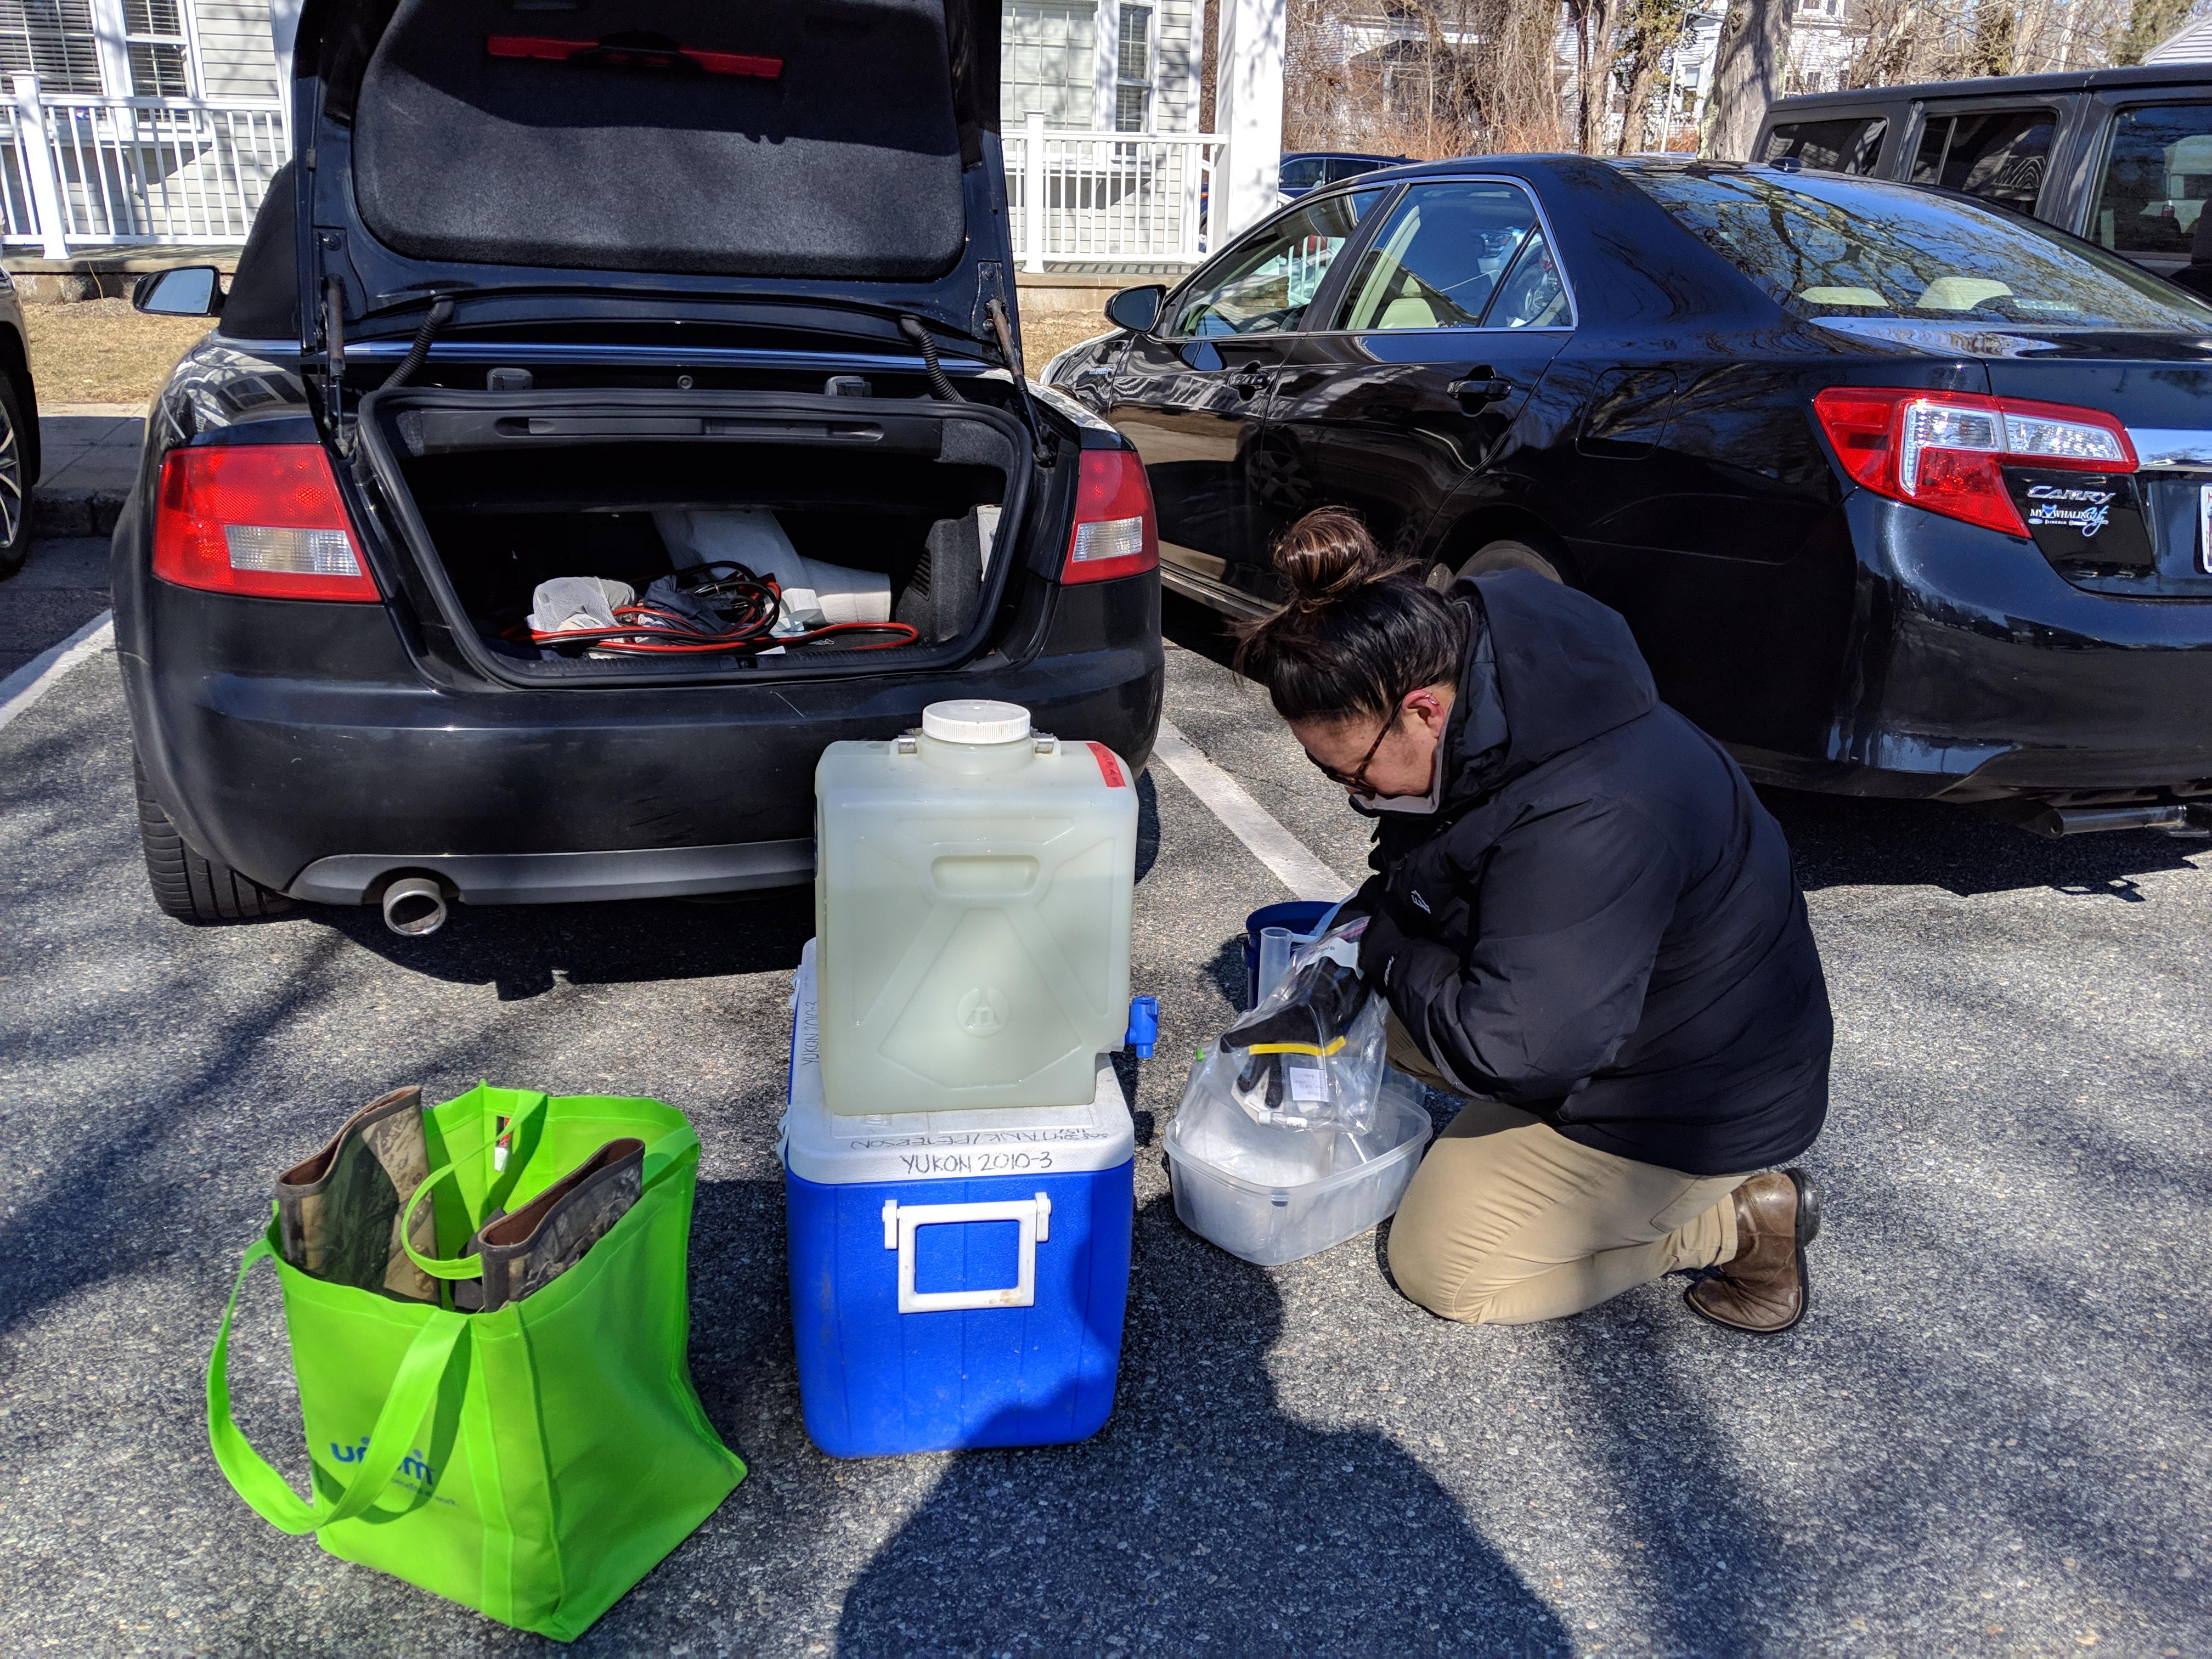
At approximately 10:30 on 6-Mar-2019, a 20 L water sample was collected from the surface of Siders Pond,
Falmouth MA (41.551115°N,
-70.619438°E)
and passed through a 335 µm Nytex mesh to
remove large organisms and particles.
Three liters of Siders Pond water was added to duplicate
chemostats at approximately 11:50 6-Mar-2019 and placed in a dark
growth chamber
at 25°C and sparged with air at a flow rate of 10 sccm. Initial medium
flow rate was turned off.
Medium flow turned on at 17:00 6-Mar-2019 (t = 0.71 d)
at a flow rate of 0.3 L d-1 or a dilution rate of 0.1 d-1.
Starting with low dilution rate for ~ 1 d to allow community spin-up.
Increased dilution rate to normal operating value of 1.0 d-1
or 3.0 L d-1 at 10:30 7-Mar-2019 (t = 1.44 d).
Some turbidity has been noticed in the nutrient feed to MC 2,
which has caused some plugging of the Sterivex in-line filter and
decrease in flow rate to MC 2 at times. First notice around 9-Mar-2019
(t = 4 d).
MC's sampled at 15:00 13-Mar-2019 (t = 7.63 d).
Introduction of air into the MCs from sample withdrawal is evident by
the temporary increase in DO and oxygen concentrations around this time.
MC's sampled at 15:40 14-Mar-2019 (t = 8.65 d).
New nutrient medium prepared and placed on-line at 18:30
14-Mar-2019 (t = 8.77 d).
Potassium phosphate injected into both MCs to increase PO4
concentration by 10 µM to test of P limitation at 15:21 15-Mar-2019 (t
= 9.65 d)
Another 10 µM increase in phosphate to both MCs occurred at 18:42
15-Mar-2019 (t = 9.78 d)
Power failure occurred at 21:52 on 15-Mar-2019 (t = 9.91 d),
which turned off the pump for the carbon medium. Pump was not
turned on until 13:18 16-Mar-2019 (t = 10.55 d).
Three mL of trace elements (adjusted to pH 7) where added to both
MCs to test for macro/micro element limitation at 10:52 18-Mar-2019 (t
= 12.45 d).
Several modifications on 19-Mar-2019: 1) 10:58 (t = 13.65 d)
Calibrated pumps, so feed interrupted for ~30 min., 2) 16:08 (t = 13.76
d) Switch to newly prepared nutrient medium, but did not 0.2 µm filter
to avoid removal an any metal-phosphate precipitates, 3) 16:16 (t =
13.68 d) carbon pump malfunction due to software bug in Masterflex pump
corrected. Pump running at higher rate than specified (10x?) for
approximately 1.25 hr.
Microcosms and feed sampled starting at 15:40 20-Mar-2019 (t =
14.65 d).
Switched to a new batch of nutrient medium and calibrated pumps
at 19:45 24-Mar-2019 (t = 18.82 d).
MCs sampled then carbon
medium replaced with carbon medium containing 99% 13C enriched glucose at
9:40 25-Mar-2019 (t = 19.40 d). The main experiment has begun!
Sampling will be frequent over the next several days.
The last 13C
samples were taken at 9:40 4-Apr-2019 (t = 29.40 d). The flow to the
MCs will be stopped soon, then run in batch mode for a short time.
Media flow to MCs stopped at 8:34 6-Apr-2019 (t = 31.36 d).
Data Files:
Primary gas and probe data: Exp3.dat
External variable values: Exp3.oc
Experimental info file: Exp3.info
Compiled high resolution data from DO and pH probes: Exp3_DOpH.csv
Higher resolution (10
min) probe data from Hamilton's RS485 ModBus (files updated here every
1 hr): (Note, these data are now plotted on the JS Graphics page)
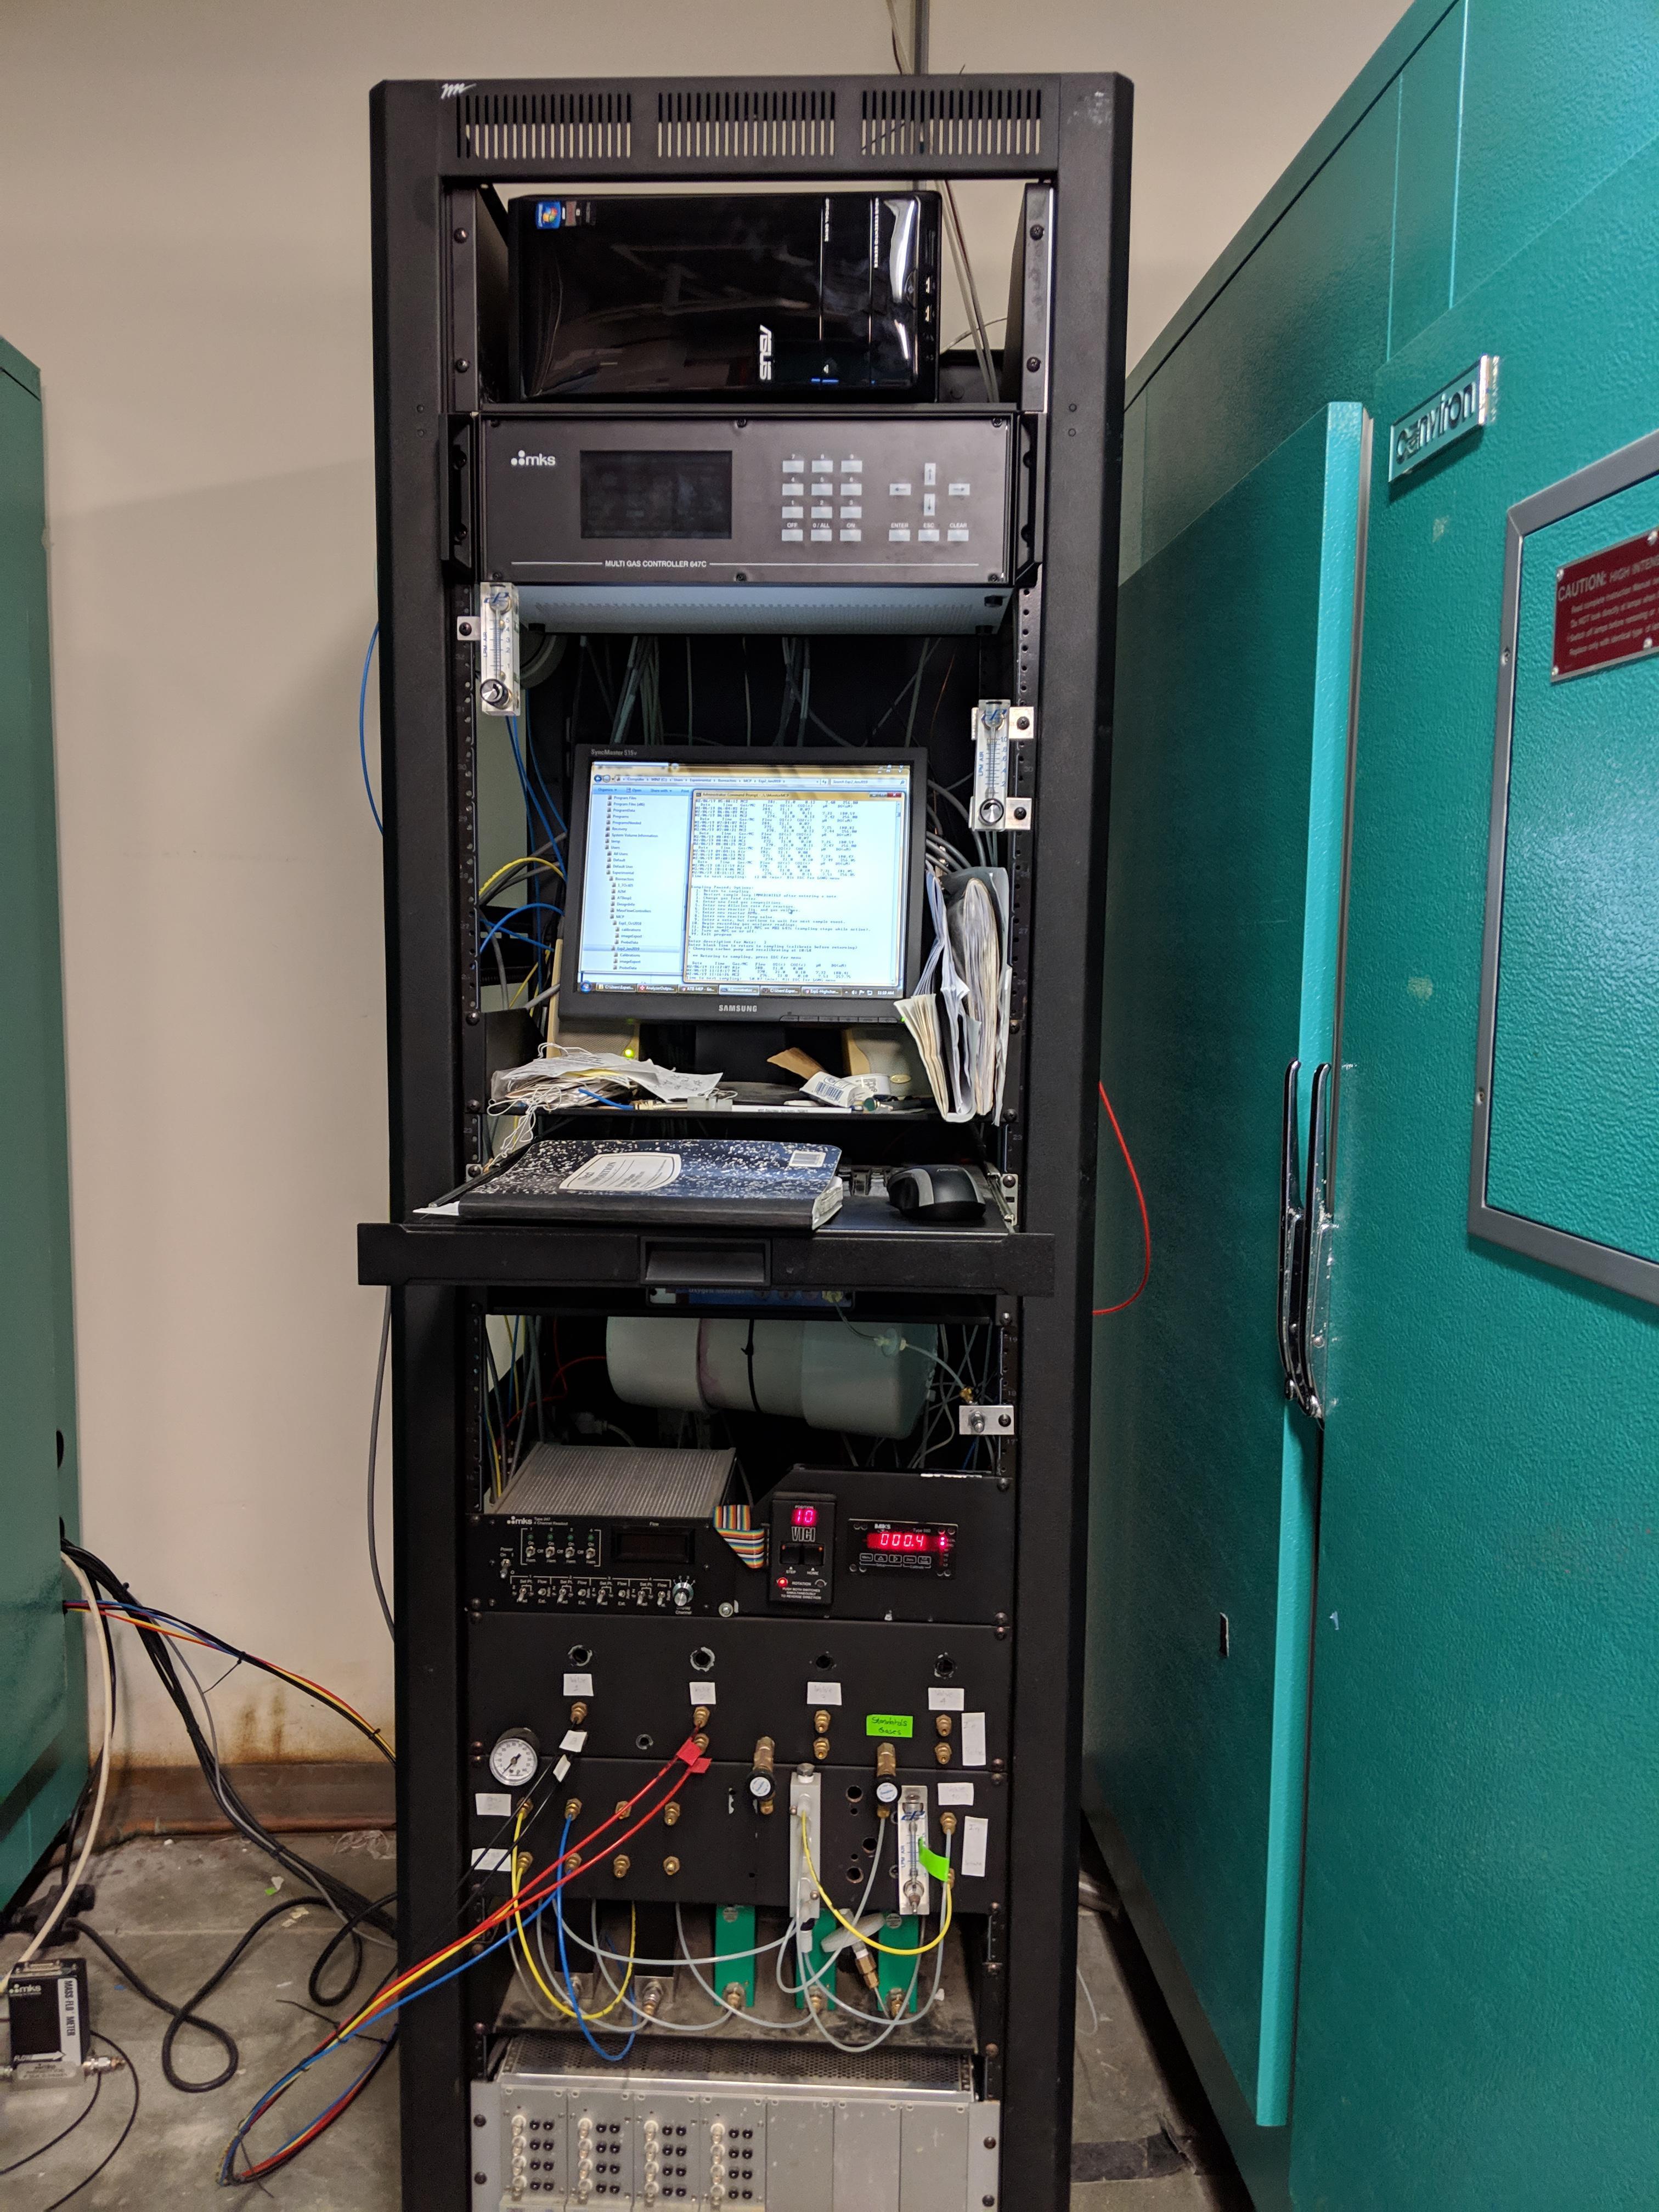
The microcosms are sparged with air in a Conviron PGR15 environmental
chamber that is currently operated at 25 ºC. A
closed gas sampling loop regulated at a flow rate of 270 mL/min by a Hargraves
mini pump
(B.1F15E4.A12VDC) delivers reactor headspace gas to analyzer.Sample
loop has an approximate volume of 20 mL. A Masterflex L/S Digital drive
connected to Easy-Load
3 peristaltic pump heads provides exchange flow between
reactors.
Software
Program for monitoring instruments and control. Note, software makes
use of Intel Visual Fortran's serial IO library:
Ashley sampling recently collected inoculum in the "field"
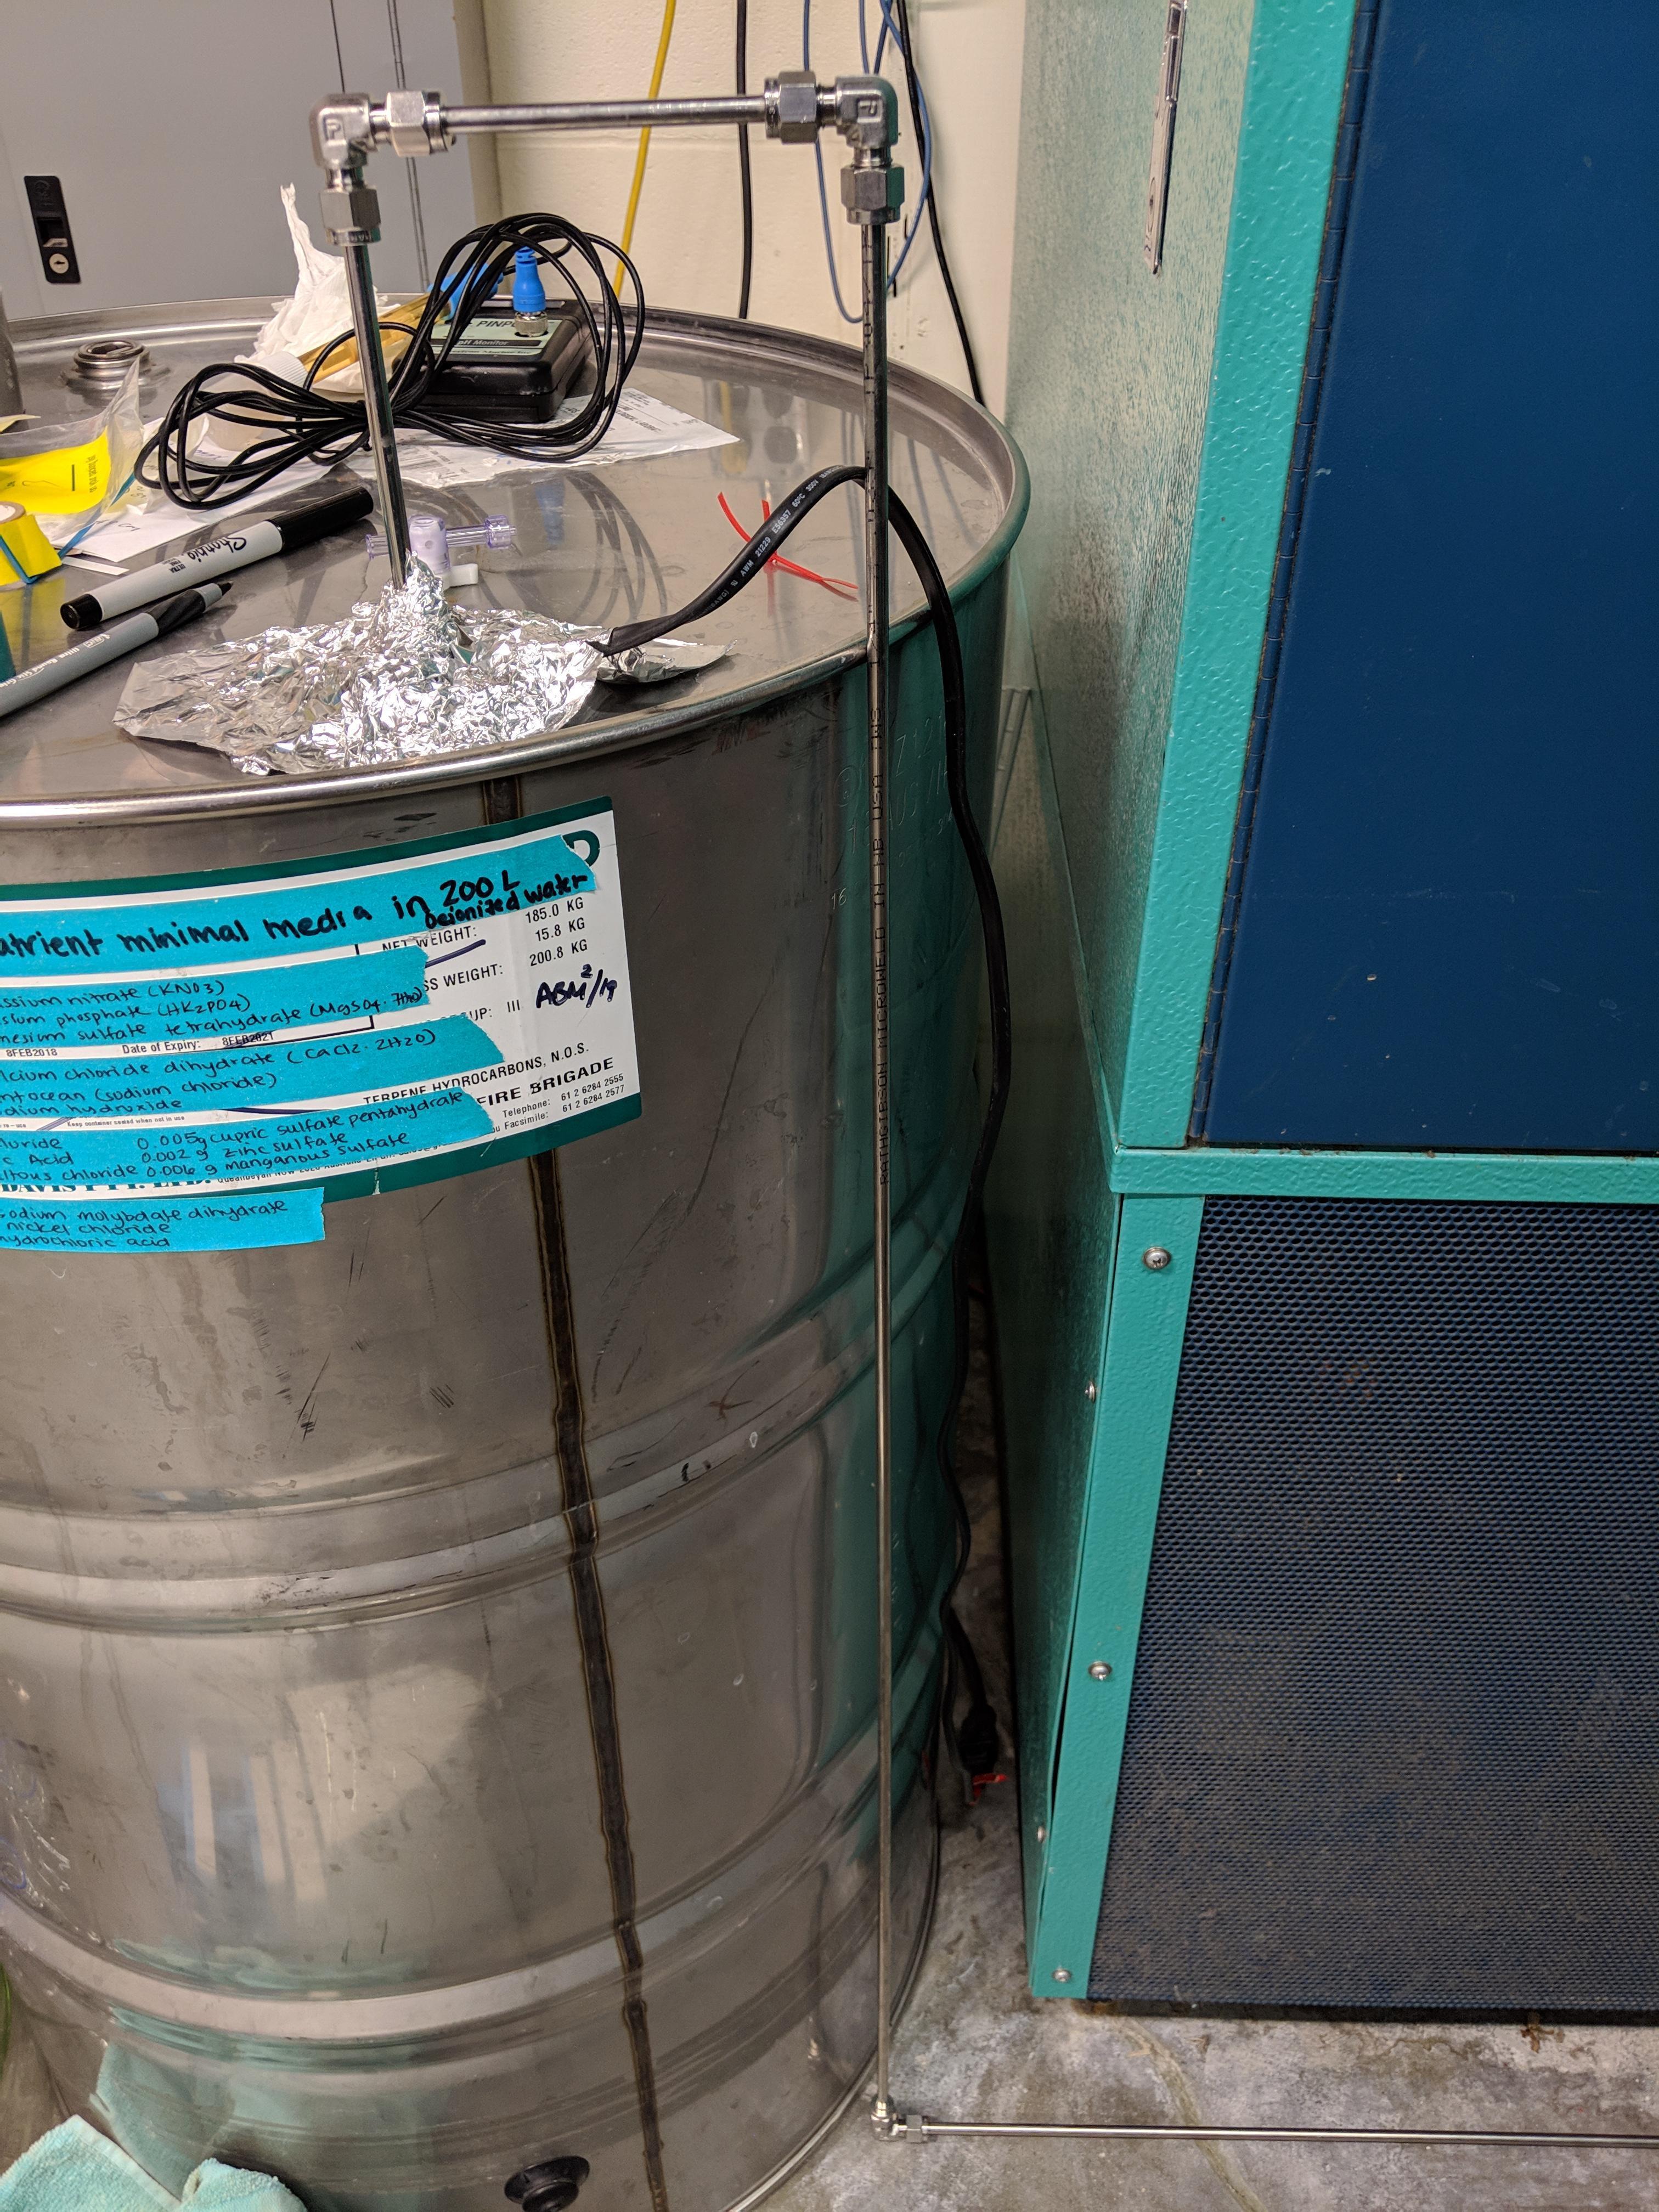
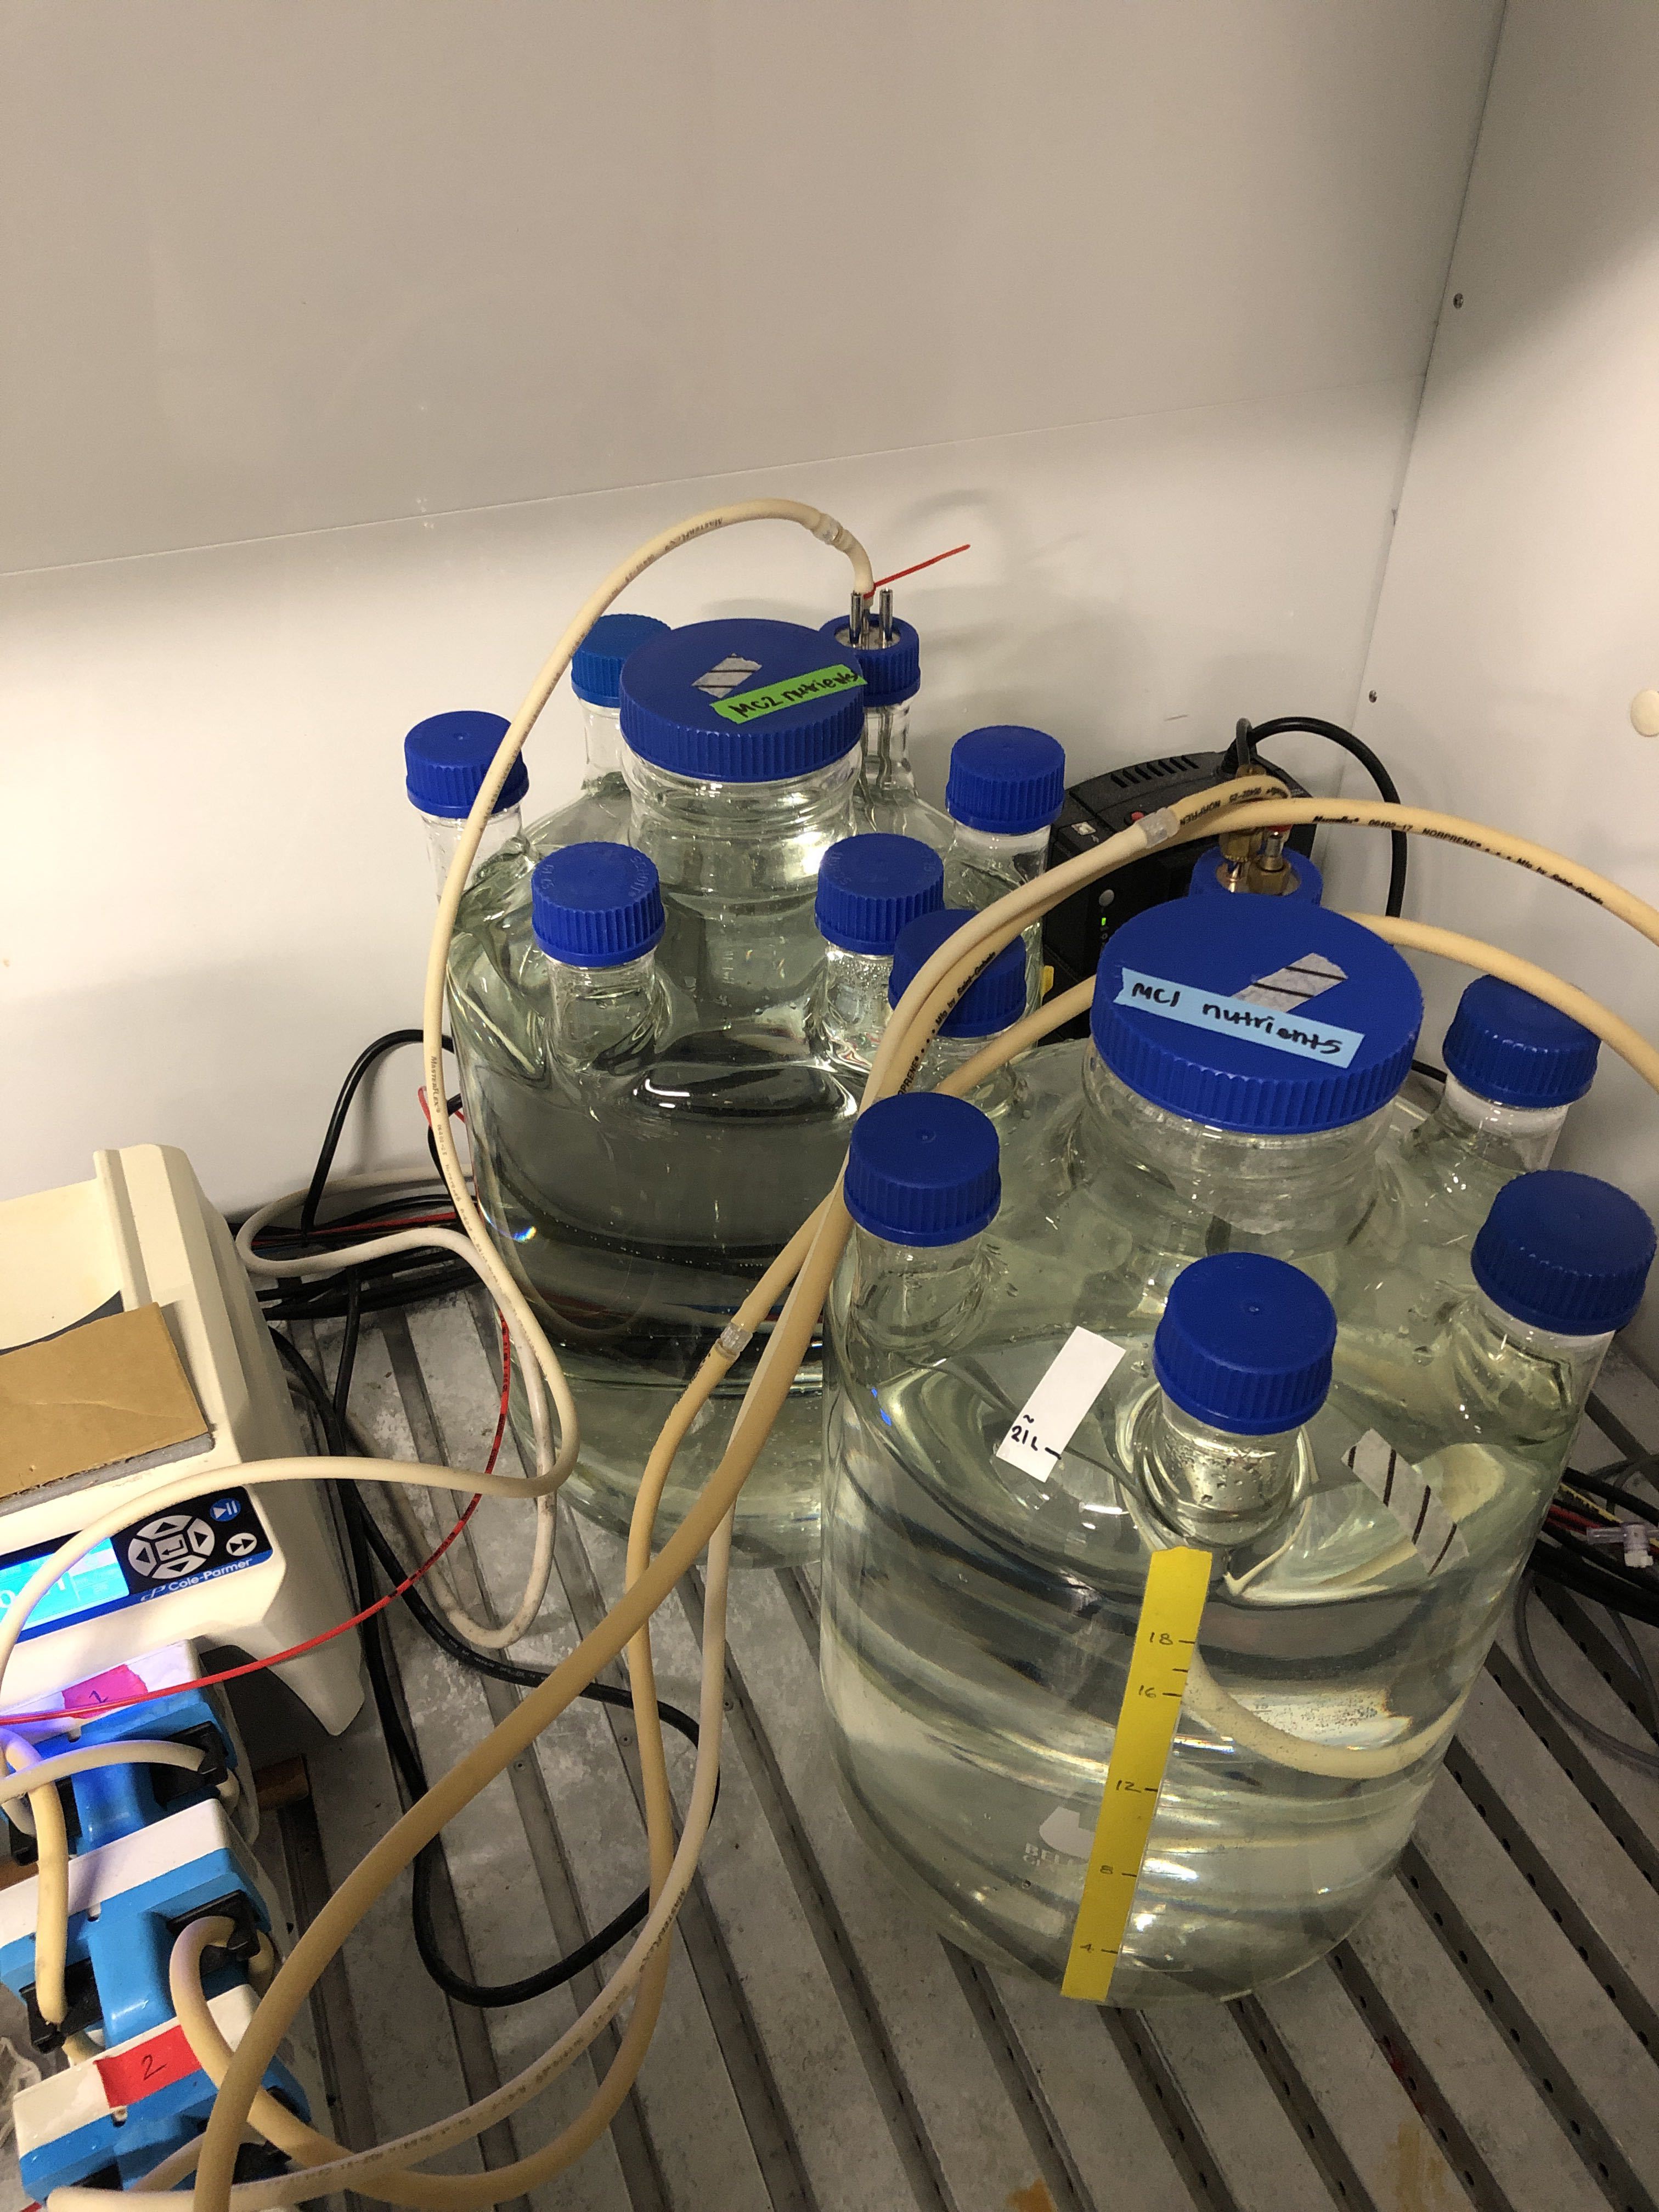
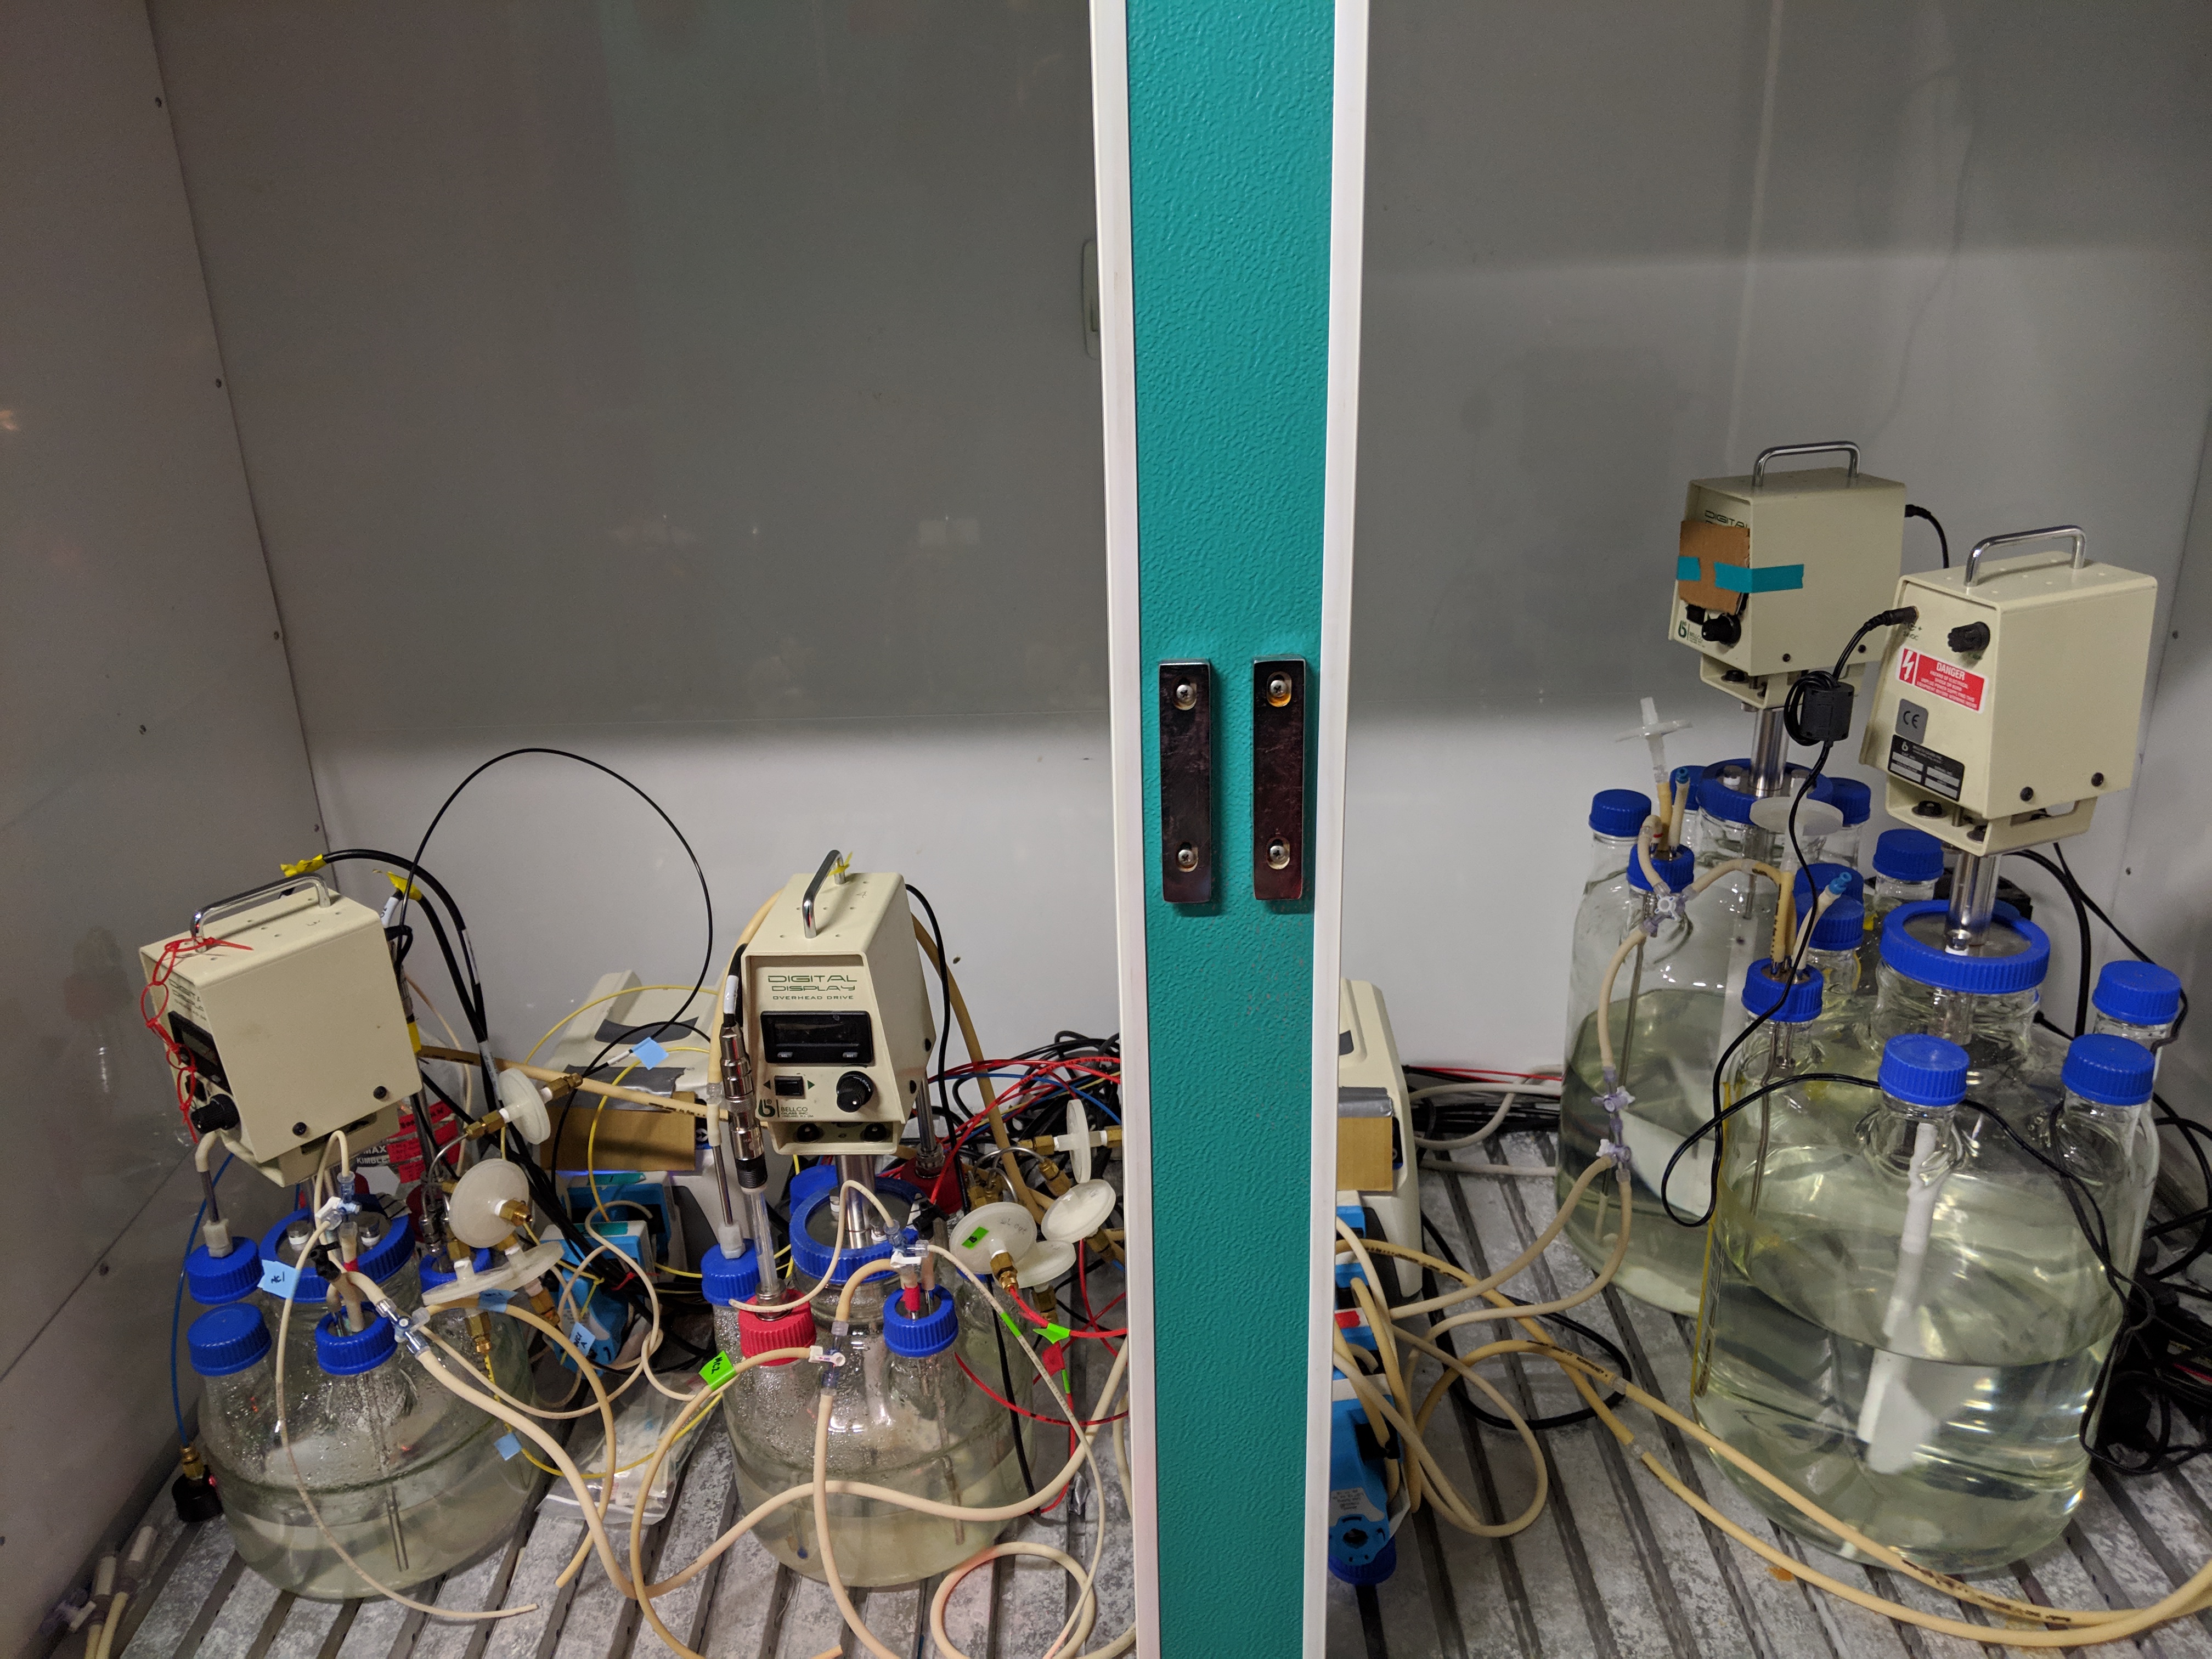
Sadly, the stainless steel nutrient medium feed drum (left) was retired
due to
some observed growth and/or corrosion. It has been replaced with
two 22 L Belco glass vessels (right) that can be autoclaved; medium is
filter sterilized now. The SS drum now collects chemostat output. UPDATE: It appears the "growth"
was actually FePO4 precipitate, which was being removed by
filtration. As of 16:08
19-Mar-2019 (t = 13.76 d),
feed medium is no longer being 0.2 µm filtered, but glass vessels are
still being used but with constant mixing to insure suspension of
micron size precipitate.
Microcosms and feed on 17:46 22-Mar-2019 (t = 16.74 d)