|
Projects
Experimental Plots
Changes in Elevation and Vegetation
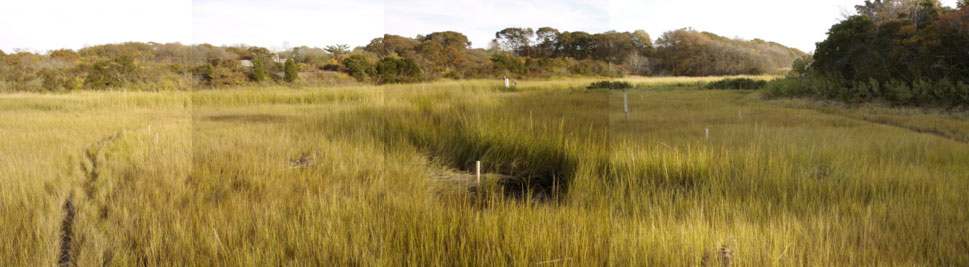
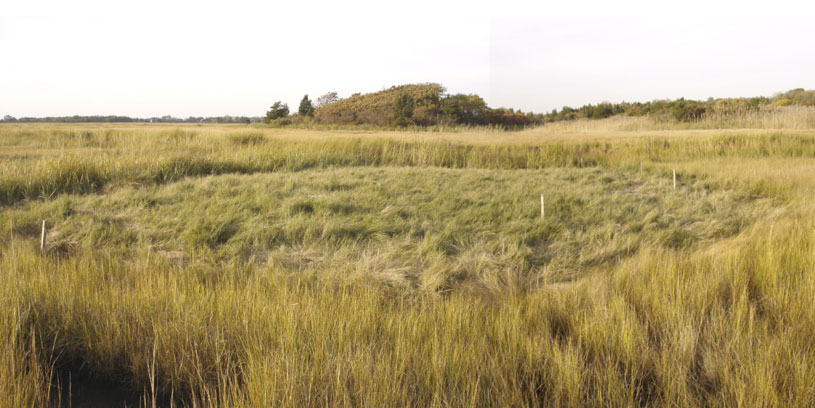
In 2005, 2007 and 2009 we mapped vegetation within the experimental plots. In 2005 we also mapped elevation within the experimental plots. Comparisons to 1976 vegetation maps show shifts in cover and spatial distribution of species due to chronic nutrient enrichment. With increasing enrichment, there was a shift in species composition primarily due to a loss of Spartina alterniflora and an increase in Distichlis spicata. Percent cover of near monocultures increased with nitrogen fertilization, owing mainly to the proliferation of D. spicata in the high marsh area. Chronic enrichment also increased the mean elevation of experimental plots, and increased the upper and lower limits of the elevation range within which certain species occurred. Shifts in the proportion of the short and taller forms of S. alterniflora occurred with increasing enrichment, taller forms increased with enrichment owing to conversion for the short form to taller forms. In addition, some plots were more frequently inundated with seawater due to sea level rise, resulting in the loss of certain high marsh species within control plots from 1976 to 2005. The interaction between nutrient supply, elevation and competition alters the direction of competitive success among different species of marsh plants, and forces changes in the spatial distribution and composition of salt marsh communities. (Fox 2007, Fox et al. in press).
Nitrogen retention
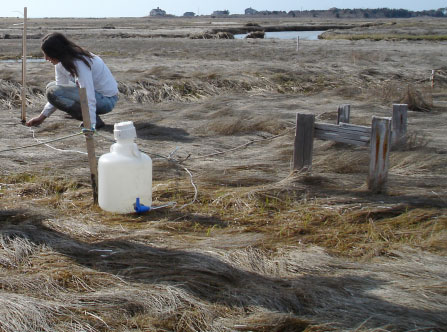
Salt marshes are thought to retain land-derived nitrogen (N) that could otherwise cause eutrophication in coastal waters. These processes need to be quantified at within-year and decadal time scales. To investigate the long-term nitrogen retention capacity of salt marshes, we measured nitrogenous materials in tidal water entering and leaving experimental plots. Results, from sampling over both full tidal cycles and intensively-sampled ebb tides, indicate that tidal dissolved inorganic nitrogen (DIN: nitrate, NO3 and ammonium, NH4+) export depended primarily on N input rate and tide height. Seasonal tidal export of NH4+ increased linearly with experimental fertilization rate, whereas export of NO3 increases exponentially, suggesting that mechanisms of NO3 removal cannot increase in parallel with N addition. Furthermore, although seasonal N export through tidewater increased significantly with increased N input, percent retention of added N was greater than 83-94% for all treatments, depending on the estimation method, an increase as compared to estimates in 1973. This suggests that ecological changes that have occurred in each plot since establishment have not inhibited long-term N retention capacity (Brin 2008, Brin and Valiela in press).
Stable isotopes in salt marsh plants and sediments
Stable isotopes are a valuable tool with which to identify nitrogen sources to plants and sediments. The sewage sludge fertilizer that has been used to fertilize the plots has a distinct δ15N signature, which has been detected in the plants within the plots. In addition, evidence of the long-term fertilization has been detected in the δ15N of the bulk sediments. Sediment cores exhibit δ15N profiles that reflect the changing nitrogen sources to the plots over time (Kinney in prep).
Salt marsh dieback experiments
In addition to our work in the experimental fertilized plots, we are also investigating possible causes for salt marsh dieback that has been observed in Great Sippewissett Marsh as well as in other marshes on Cape Cod.
Warming- There are several lines of evidence that suggest that warming, enhanced by dry conditions, may be a possible forcing factor causing marsh dieback. Coastal air and water temperatures have increased globally (reviewed in Valiela 2006), and there is convincing evidence that warming of air and water has taken place in the Cape Cod region (Fig. 4, and Nixon et al. 2004, Oviatt 2004). We hypothesize that as our coastal climate warms, short-term episodes of out-of-the-ordinary temperatures could intermittently kill parcels of marsh grass. Anecdotally, we accidentally found that transparent plastic chambers unwittingly left unattended over cordgrass for several hours during a sunny day became hot enough to kill the grass within the chamber.
One possible specific mechanism that could mediate marsh dieback could be the metabolic use of freshwater by marsh plants. Some time ago, evapo-transpiration (ET) rates were measured in Great Sippewissett marsh; about 5 L of freshwater per m2 per day are released to air from cordgrass stands (Dacey and Howes 1984); if that water is not replaced by freshwater, porewater salinities may in short order surpass 40%, enough to harm cordgrass. Laboratory work showed that substrate salinities >40% impaired physiological function and growth in salt marsh grasses (Haines and Dunn 1976). In contrast, Mendelssohn and McKee (1988) conclude that salinity might not be involved in lowering growth of salt marsh grasses, but we have pilot experimental field evidence that such salinity increases can lead to death of the marsh sward. Broadcasting salt crystals onto marsh plots, or injecting brine into the upper 10 cm of sediment, led to porewater salinities >40% and death of the grasses within a few days of treatment (Valiela et al. 1985, and Fig. 5). We therefore conjecture, and will test the hypothesis, that increased temperatures could directly increase ET, and the resulting greater removal of freshwater from sediments could indirectly raise porewater salinity to a level inimical for survival of marsh plants.
To assess whether episodes of warmer temperatures increase evapo-transpiration, and hence increase porewater salinity and sulfides, and lower Eh and pH, conditions that could lead to dieback, we ran short-term experiments designed to create a warmer above-ground environment. We placed roofed 1x1 m transparent Tefzel cages over marsh plots for suitable duration of exposures to create warmer temperature regimes for the stands of marsh grass under the cages.
Temperatures at canopy level in Cape Cod salt marshes during low tide can reach over 40oC during sunny summer days; as our climate warms, we anticipate that canopy-level temperatures might reach higher values. We created temperature regimes that reach 30, 40, and 50oC within the cages. These are within expected ranges of future temperatures. To create the different temperature regimes we built and installed cages with different degrees of ventilation. The ventilation was regulated by providing different numbers of open vents along the upper edge of the cages.
We ran replicate cages simultaneously of different temperature regimes. The duration of the treatment was 8 days to test whether length of exposure to elevated temperature matters. Within each cage, we measured temperature (Hobo data loggers) within the cages, and ET and photosynthesis (Licor 6200 photosynthesis and vapor exchange recorders) in 3 leaves in each cage during the experiment. After the exposure we sampled porewater to measure salinity and sulfide as a proxy for redox. Pore-water sulfides were measured spectrophotometrically using methods of Gilboa-Garber (1971). With these data we will define functions relating air temperature to ET and photosynthesis, and estimate water loss from porewater, predict and validate salinity in porewater, and establish when warming conditions might lead to dieback.
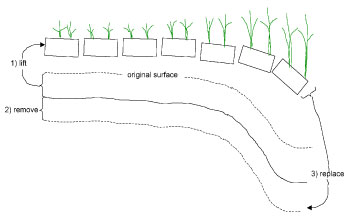
Sea level rise -- To see if increased submergence leads to dieback, we conducted an experimental manipulation of the elevation of the salt marsh surface. The first step was 1) to carefully cut and lift 20x20 cm blocks of marsh, working from the creek bank towards the upper marsh, until we have removed 10 sections. This work was done in late winter, while the vegetation is dormant so that little damage to the stands will be done. The sections lifted out of the marsh were 15 cm deep, enough to contain about 90% of live roots and rhizomes (Valiela et. al. 1976).
|
 |
|
Fig. 1. Sketch of the marsh surface elevation manipulation. The manipulation will involve three steps: 1) lifting blocks of marsh peat that contain most of the live root mass; 2) removing a layer of underlying peat so that when we replace the blocks, the upper surface
|
Then, 2) to create different levels of marsh surface, we removed layers of 2, 5, and 10 cm of the underlying peat sediment (Fig. 1, step 2). Then, 3) we replaced the blocks containing the live plants back unto the sediment, and anchored the blocks with plastic pins and wickets. Anchoring is necessary to prevent removal during high tides.
These three steps result in plots of marsh plants growing lower than previously, and submerged for correspondingly longer intervals during high tide. There are blocks treated the same but with no removal of underlying peat, to act as controls for the manipulation.
At each elevation site, we measured vegetation, biomass and sulfide concentrations.
|
|